. 2014 Jun 13:4:5285.
doi: 10.1038/srep05285.

A method to identify and validate mitochondrial modulators using mammalian cells and the worm C. elegans

Affiliations

A method to identify and validate mitochondrial modulators using mammalian cells and the worm C. elegans

Pénélope A Andreux et al. Sci Rep. .

Abstract

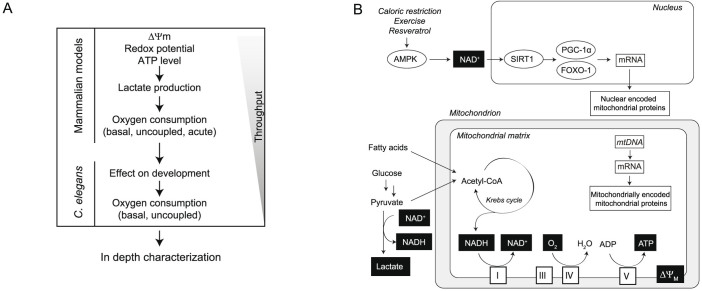
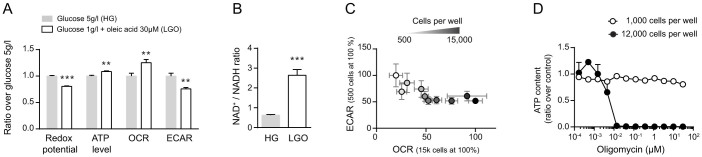
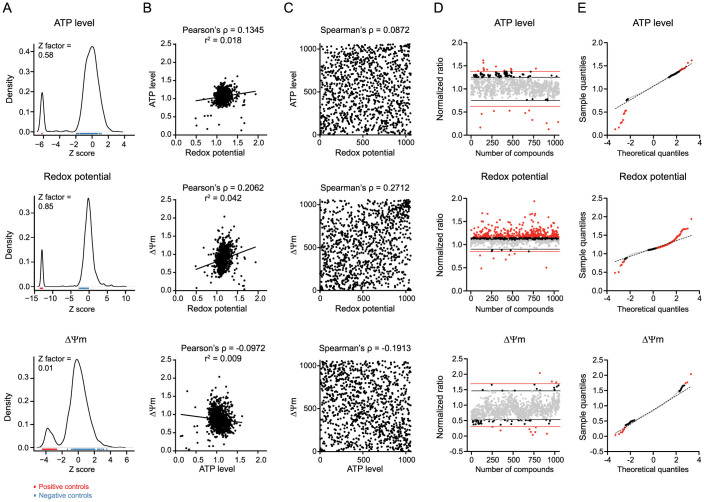
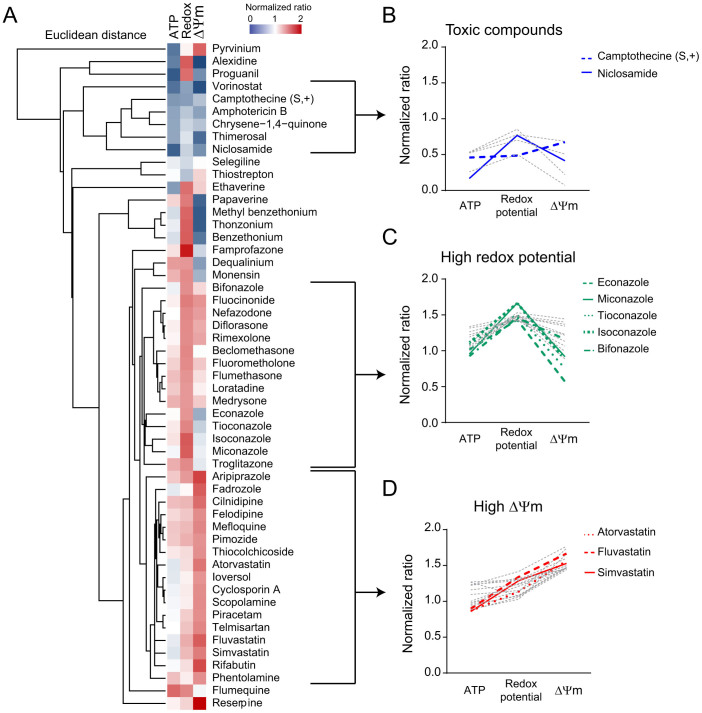
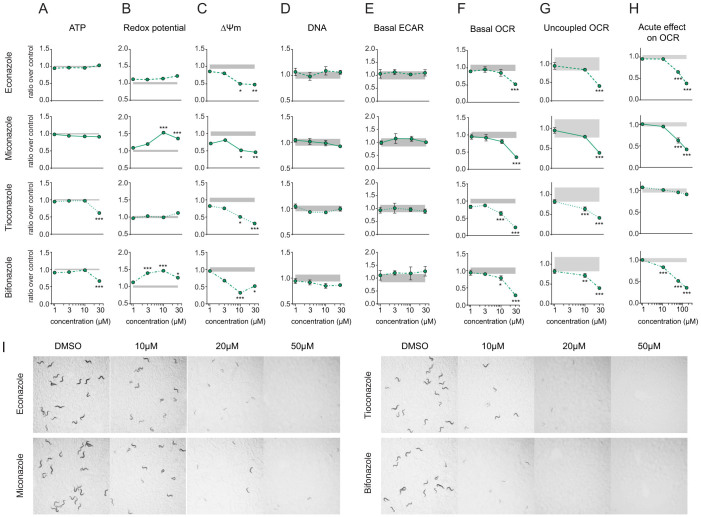
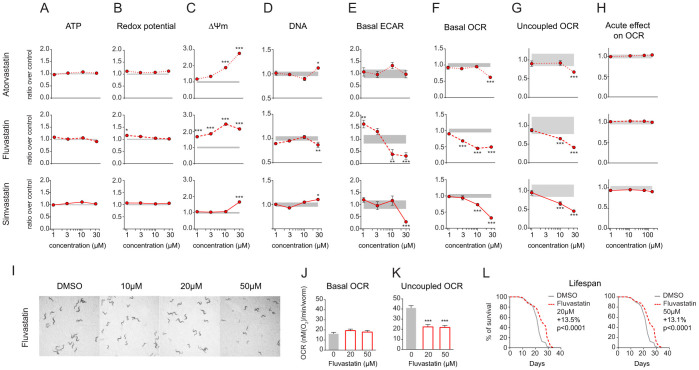
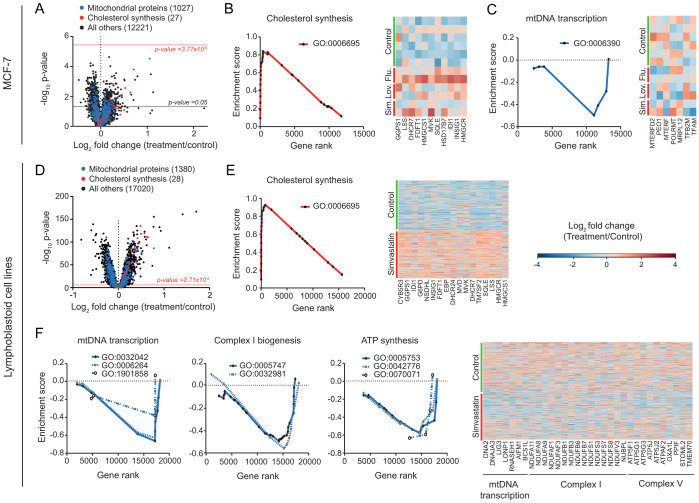
Mitochondria are semi-autonomous organelles regulated by a complex network of proteins that are vital for many cellular functions. Because mitochondrial modulators can impact many aspects of cellular homeostasis, their identification and validation has proven challenging. It requires the measurement of multiple parameters in parallel to understand the exact nature of the changes induced by such compounds. We developed a platform of assays scoring for mitochondrial function in two complementary models systems, mammalian cells and C. elegans. We first optimized cell culture conditions and established the mitochondrial signature of 1,200 FDA-approved drugs in liver cells. Using cell-based and C. elegans assays, we further defined the metabolic effects of two pharmacological classes that emerged from our hit list, i.e. imidazoles and statins. We found that these two drug classes affect respiration through different and cholesterol-independent mechanisms in both models. Our screening strategy enabled us to unequivocally identify compounds that have toxic or beneficial effects on mitochondrial activity. Furthermore, the cross-species approach provided novel mechanistic insight and allowed early validation of hits that act on mitochondrial function.


Conflict of interest statement

J.A. is a co-founder and scientific advisor to Mitokyne. None of the other authors declare a conflict of interest.

Figures

Figure 1
Figure 1. Assays platform for the identification and validation of novel mitochondrial modulators.
(A) Workflow to assess mitochondrial function going from hundreds of compounds to the best candidates (top to bottom) in mammalian cells and C. elegans. After hits have been identified during a high-throughput screening, they are assessed for their efficiency and toxicity on mitochondrial function using this assay platform. Once the best candidates have been sorted out, they can be further investigated in both models, and ultimately in vivo. (B) The different pathways that are assessed and the respective markers that were measured (black boxes). This scheme is non-exhaustive and represents only the key regulatory steps that are surveyed. More details can be found in the main text.
Figure 2
Figure 2. Optimization of the cell culture conditions.
(A–D) Reduction in glucose concentration and supplementation with oleic acid shifts cells toward oxidative metabolism. (A) Redox potential, ATP level, oxygen consumption rate (OCR) and extra-cellular acidification rate (ECAR) measured in Hepa1.6 cells after 24 hours incubation in the indicated growth medium. (B) NAD+/NADH ratio determined in Hepa1.6 cells after 24 hours incubation with high glucose (5 g/l, HG); or low glucose (1 g/l) supplemented with 30 μM oleic acid (LGO) (C) Hepa1.6 cells shift toward oxidative metabolism with increasing cell confluence. OCR values are represented as a percentage of the value measured with 15,000 cells per well. ECAR values are represented as a percentage of the value measured with 500 cells per well. (D) Hepa1.6 cells are only sensitive to oligomycin at higher cell density (12,000 cells/well versus 1,000 cells/well). ATP content was normalized for each cell density over the vehicle treated control cells. For A and B, Statistical significance was determined by Student's t-test, with * P<0.05, ** P<0.01, *** P<0.001. Graphs represent mean ± SEM.
Figure 3
Figure 3. Screening of 1,200 FDA approved drugs in the Hepa1.6 cell line.
(A–E) Screening of the Prestwick library of FDA approved drugs, using the three basal assays and oxidative cell culture conditions, i.e. low glucose concentration (1 g/l), supplementation with oleic acid at 30 μM and cell density of 95% the day of the assays. (A) Cell-based assays screening separation bandwidth. Plots represent the cumulative density of points over Z scores of the raw values for all the points of the screening, including negative (blue points) and positive controls (red points) and samples. The redox potential assay has the best separation capacity with narrow peaks of negative and positive controls on the density plot and a Z factor close to 1. (B–C) Correlations between the three cell-based assays show poor level of relationship between the different parameters. (B) Pearson's ρ correlation coefficients and their corresponding regression r2 value were calculated for normalized ratios of the three parameters. (C) Spearman's ρ correlation coefficient was calculated for the correlation between rank orders of every parameter. (D) Graphs represent the normalized ratio calculated as described in the materials and methods section. The black lines delimit the zone of compounds inducing a change inferior to DMSO ± 2σDMSO, and the red lines the zone of compounds inducing a change superior to DMSO ± 3σDMSO. (E) Graphs represent the quantile-quantile (QQ) plots, plotting the theoretical quantiles for each assay in x-axis over the normalized ratio in y-axis. The grey points correspond to compounds inducing a change inferior to DMSO ± 2σDMSO, the black points to a change comprised between DMSO ± 2σDMSO and DMSO ± 3σDMSO, and the red points to a change superior to DMSO ± 3σDMSO.
Figure 4
Figure 4. Hierarchical clustering and profiles of the 53 hits.
(A) Hierarchical clustering of the 3 parameters for the 53 hits. Compounds were considered as hits when inducing a change superior to DMSO ± 2σDMSO and when deviating from normal distribution (see methods section). Heatmap represents intensities of normalized ratios. (B–D) Remarkable profiles, i.e. combinations of the scores in each of the assays. (B) Profiles of toxic compounds that reduce significantly the three parameters. (C) Profiles of the cluster of compounds that increase significantly redox potential only. (D) Profiles of the cluster of compounds that increase significantly Δψm only.
Figure 5
Figure 5. Impact of imidazoles on cellular and C. elegans metabolism.
(A–G) Effect of 24 hours treatment with econazole, miconazole, tioconazole and bifonazole in Hepa1.6 on ATP level (A), redox potential (B), Δψm (C), DNA content (D), extra-cellular acidification rate (ECAR) (E), basal oxygen consumption rate (OCR) (F) and uncoupled OCR (G). (H) Acute effect of imidazoles on OCR in Hepa1.6. Measurement was performed 3 minutes after addition of the compounds. Results are expressed as ratio over DMSO control and as mean ± SEM. Grey zone represents the DMSO 95% confidence interval. Significance was tested using a two-way ANOVA test, with Bonferroni correction for multiple comparison. * P<0.05, ** P<0.01 and *** P<0.001. Graphs represent mean ± SEM. (I) Econazole, miconazole, tioconazole and bifonazole impair the development of C. elegans N2 worms at all tested concentrations. Pictures were taken at day 3 of adulthood.
Figure 6
Figure 6. Impact of statins on cellular and C. elegans metabolism.
(A–G) Effect of 24 hours treatment with atorvastatin, fluvastatin and simvastatin in Hepa1.6 on ATP level (A), redox potential (B), Δψm (C), DNA content (D), extra-cellular acidification rate (ECAR) (E), basal oxygen consumption rate (OCR) (F) and uncoupled OCR (G). (H) Acute effect of statins on OCR in Hepa1.6. Measurement was performed 3 minutes after addition of the compounds. (I) Fluvastatin does not impair the development of C. elegans N2 worms at 10, 20 and 50 μM. Pictures were taken at day 3 of adulthood. (J–K) Effect of fluvastatin on basal OCR (J) and uncoupled OCR (K) at day 1 of adulthood. (L) Lifespan in N2 worms after treatment with fluvastatin at 20 and 50 μM. Results are expressed as ratio over DMSO control and as mean ± SEM. Grey zone represents the DMSO 95% confidence interval. Significance was tested using a two-way ANOVA test, with Bonferroni correction for multiple comparison. * P<0.05, ** P<0.01 and *** P<0.001.
Figure 7
Figure 7. Impact of simvastatin on gene expression in MCF-7 cells and human lymphoblastoid cell lines.
(A–C) Effect of three statins, fluvastatin (Flu.), lovastatin (Lov.) and simvastatin (Sim.), on gene expression in MCF-7 cells after 6 hours treatment at 10 μM. (A) Vulcano plot of microarray dataset. Treatment/control fold change expression was determined by calculating first the average expression for all statins and DMSO treatments. Cholesterol synthesis geneset (GO:0006695) and mitochondria geneset (GO:0005739) are represented in red and blue, respectively. Black horizontal bar corresponds to the significance threshold for a nominal p-value of 0.05, while the red horizontal bar corresponds to the p-value for multiple testing after Bonferroni correction. (B) Positive enrichment score indicates that MCF-7 cells induce cholesterol synthesis genes (geneset GO:0006695, p<0.01) following sterol depletion. (C) Negative enrichment score for mtDNA transcription genes (geneset GO:0006390, q = 0.24) shows that mtDNA processing is downregulated after statins treatment in MCF-7 cells. (D–F) Effect of simvastatin on gene expression in lymphoblastoid cell lines derived from patients after 24 hours treatment at 3 μM. (D) Vulcano plot of microarray dataset. Cholesterol synthesis geneset (GO:0006695) and mitochondria geneset (GO:0005739) are represented in red and blue, respectively. The red horizontal bar corresponds to the p-value for multiple testing after Bonferroni correction. (E) Positive enrichment score indicates that in lymphoblastoid cells simvastatin induces cholesterol synthesis genes (geneset GO:0006695, p<0.001). (F) Negative enrichment scores for mtDNA transcription genes (genesets GO:0006264, q = 0.009; GO:0032042, q = 0.003 and GO:1901858, q = 0.084), respiratory complex I (genesets GO:0005747, q = 0.052 and GO:0032981, q = 0.143) and respiratory complex V (genesets GO:005753, q = 0.015; GO:0042776, q = 0.039 and GO:0070071, q = 0.079) show that respiratory complexes and mtDNA processing is downregulated after simvastatin treatment in lymphoblastoid cells. For B, C, E and F, genesets were determined according to Gene Ontology annotation (www.geneontology.org). Heatmaps represented in E and F show only the genes that are significantly differentially expressed between control (green bar) and statin (red bar) treated samples according to nominal p values.

References

    1. Wallace D. C. Mitochondrial diseases in man and mouse. Science. 283, 1482–8 (1999). - PubMed
    1. Vafai S. B. & Mootha V. K. Mitochondrial disorders as windows into an ancient organelle. Nature. 491, 374–83 (2012). - PubMed
    1. Andreux P. A., Houtkooper R. H. & Auwerx J. Pharmacological approaches to restore mitochondrial function. Nat Rev Drug Discov. 12, 465–83 (2013). - PMC - PubMed
    1. Argmann C. A., Chambon P. & Auwerx J. Mouse phenogenomics: the fast track to “systems metabolism”. Cell Metab. 2, 349–60 (2005). - PubMed
    1. Peters L. L. et al. The mouse as a model for human biology: a resource guide for complex trait analysis. Nat Rev Genet. 8, 58–69 (2007). - PubMed

Publication types

MeSH terms