. 2014 Jun 12:13:98.
doi: 10.1186/1475-2840-13-98.

Caffeic acid phenethyl amide ameliorates ischemia/reperfusion injury and cardiac dysfunction in streptozotocin-induced diabetic rats

Affiliations

Caffeic acid phenethyl amide ameliorates ischemia/reperfusion injury and cardiac dysfunction in streptozotocin-induced diabetic rats

Yi-Jin Ho et al. Cardiovasc Diabetol. .

Abstract

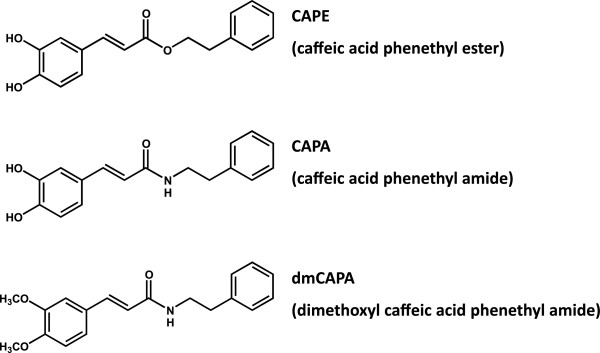
Background: Caffeic acid phenethyl ester (CAPE) has been shown to protect the heart against ischemia/reperfusion (I/R) injury by various mechanisms including its antioxidant effect. In this study, we evaluated the protective effects of a CAPE analog with more structural stability in plasma, caffeic acid phenethyl amide (CAPA), on I/R injury in streptozotocin (STZ)-induced type 1 diabetic rats.

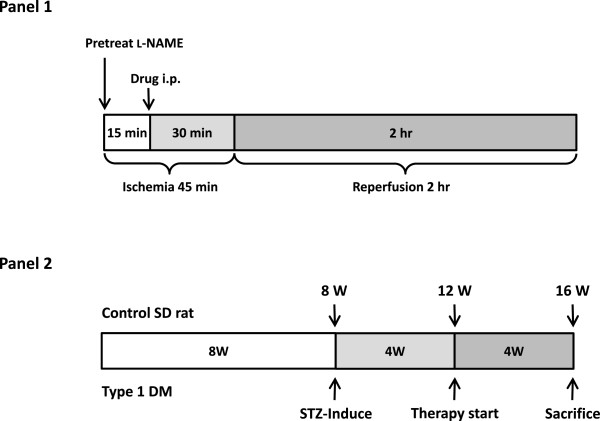
Methods: Type 1 diabetes mellitus was induced in Sprague-Dawley rats by a single intravenous injection of 60 mg/kg STZ. To produce the I/R injury, the left anterior descending coronary artery was occluded for 45 minutes, followed by 2 hours of reperfusion. CAPA was pretreated intraperitoneally 30 minutes before reperfusion. An analog devoid of the antioxidant property of CAPA, dimethoxyl CAPA (dmCAPA), and a nitric oxide synthase (NOS) inhibitor (Nω-nitro-l-arginine methyl ester [l-NAME]) were used to evaluate the mechanism involved in the reduction of the infarct size following CAPA-treatment. Finally, the cardioprotective effect of chronic treatment of CAPA was analyzed in diabetic rats.

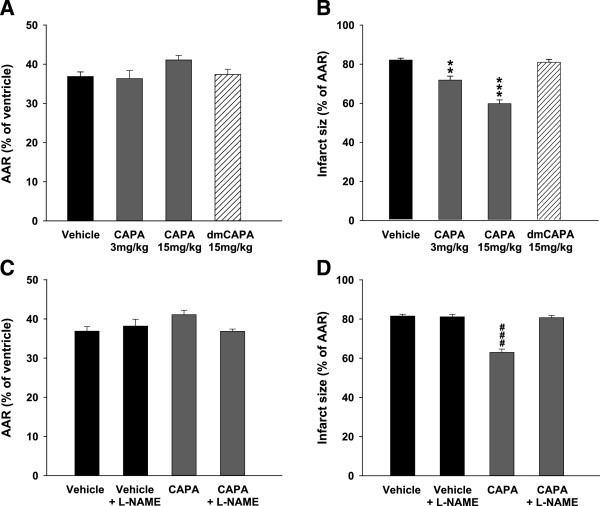
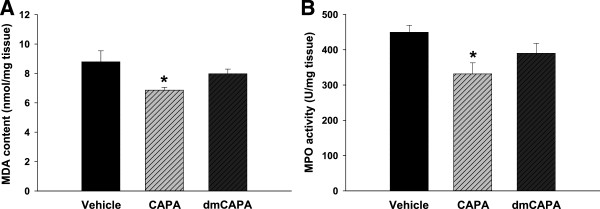
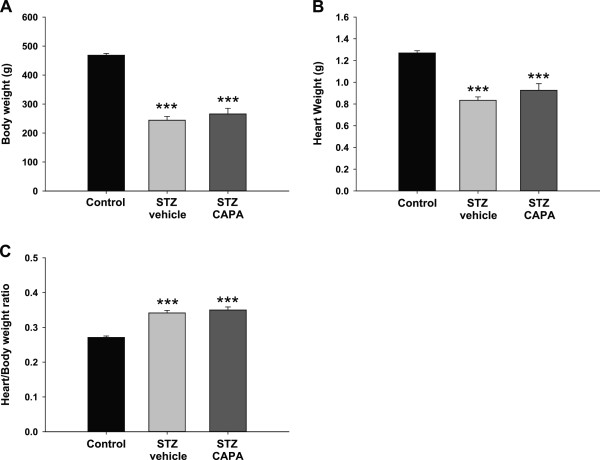
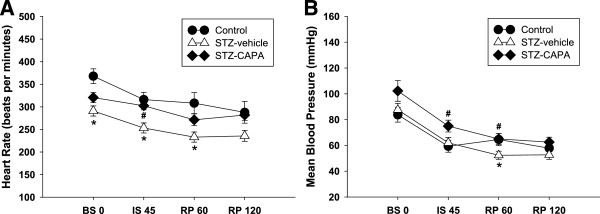
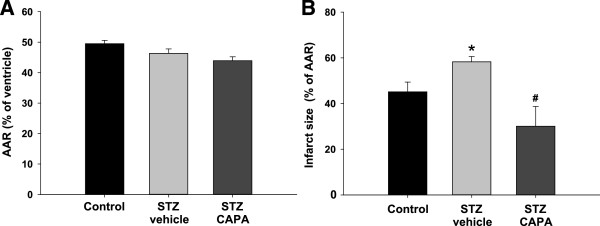
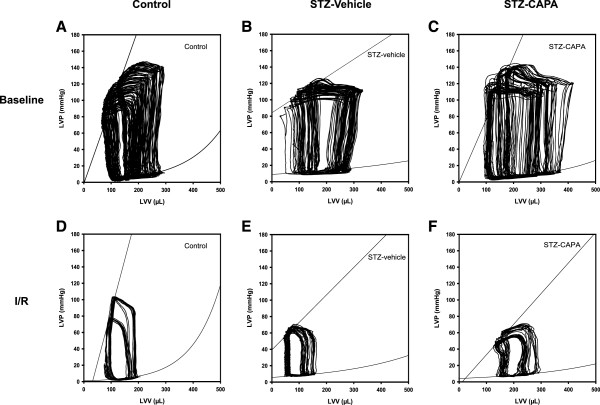
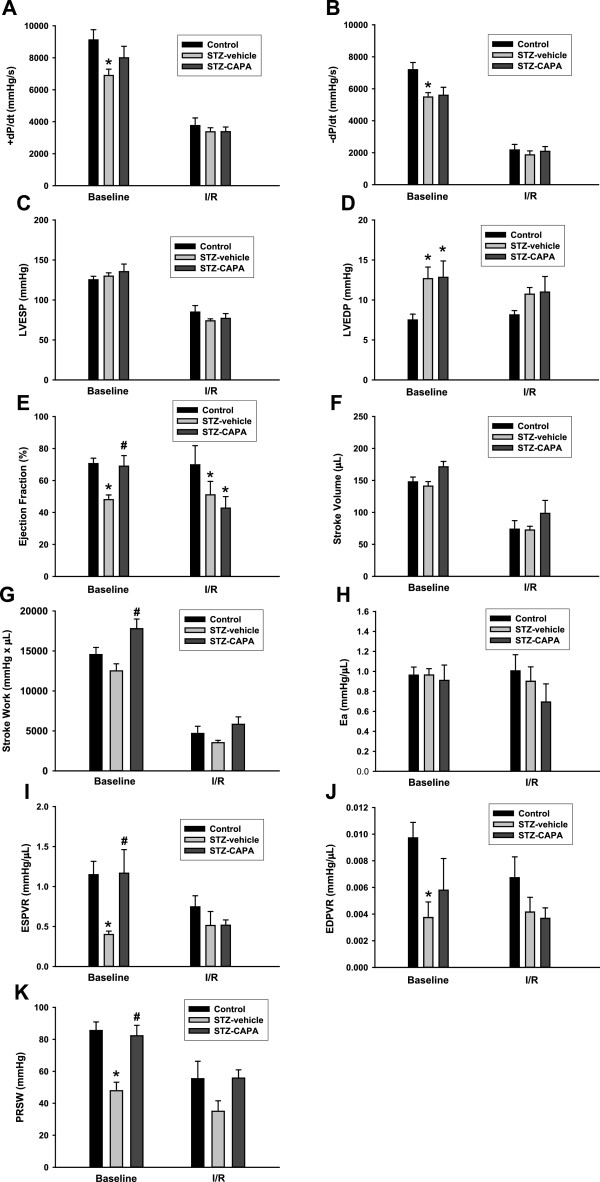
Results: Compared to the control group, CAPA administration (3 and 15 mg/kg) significantly reduced the myocardial infarct size after I/R, while dmCAPA (15 mg/kg) had no cardioprotective effect. Interestingly, pretreatment with a NOS inhibitor, (L-NAME, 3 mg/kg) eliminated the effect of CAPA on myocardial infarction. Additionally, a 4-week CAPA treatment (1 mg/kg, orally, once daily) started 4 weeks after STZ-induction could effectively decrease the infarct size and ameliorate the cardiac dysfunction by pressure-volume loop analysis in STZ-induced diabetic animals.

Conclusions: CAPA, which is structurally similar to CAPE, exerts cardioprotective activity in I/R injury through its antioxidant property and by preserving nitric oxide levels. On the other hand, chronic CAPA treatment could also ameliorate cardiac dysfunction in diabetic animals.


Figures

Figure 1
Figure 1
Chemical structures of CAPE, CAPA and dmCAPA.
Figure 2
Figure 2
Ischemia/reperfusion model and chronic treatment time course in type 1 diabetic rats. All animals underwent coronary artery occlusion for 45 min followed by 2 hours of reperfusion. CAPA (3 and 15 mg/kg) and dmCAPA (15 mg/kg) were administered intraperitoneally 30 min before reperfusion while the NOS inhibitor (l-NAME; 3 mg/kg, intraperitoneal) was given before LAD occlusion (panel 1). For chronic treatment, type 1 diabetes was induced by STZ over 4 weeks in 8-week-old rats that were then treated with vehicle or CAPA for 4 weeks (panel 2).
Figure 3
Figure 3
Effects of CAPA, dmCAPA andl-NAME pretreatment on I/R injury. (A) Area at risk (AAR; % of ventricle) and (B) infarct size (% of AAR) in control rats treated with vehicle and in rats treated with CAPA (3 or 15 mg/kg) and dmCAPA (15 mg/kg). **P < 0.01 and ***P < 0.001 compared to vehicle. (C) AAR (% of ventricle) and (D) infarct size (% of AAR) in control rats treated with vehicle and in rats pretreated with l-NAME (3 mg/kg) and treated with CAPA (15 mg/kg). ###P < 0.001 compared to vehicle. Data (mean ± SEM) were obtained from 6–8 animals.
Figure 4
Figure 4
Effects of CAPA treatment on MDA levels and MPO activity. We administered CAPA (15 mg/kg, n = 10) and dmCAPA (15 mg/kg, n = 5) after 45 minutes of LAD ligation followed by 2 hours of reperfusion. After I/R, the tissue in the area at risk was collected for measurement of MDA levels (A) and MPO activity (B). *P < 0.05 compared with controls.
Figure 5
Figure 5
Effects of CAPA treatment on body weight and heart weight. After I/R, the body weight (A), heart weight (B), and heart/body weight ratio (C) were calculated. For chronic treatments, the animals were divided into three groups: control, age- and sex-matched normal rats, n = 16; STZ-vehicle, age- and sex-matched diabetic animals administered distilled water orally for 4 weeks starting 4 weeks after STZ induction, n = 13; and STZ-CAPA, CAPA 1 mg/kg administered orally once daily for 4 weeks starting 4 weeks after STZ induction, n = 6. Data are expressed as mean ± SEM. ***P < 0.001 compared with control group.
Figure 6
Figure 6
Effects of CAPA treatment on heart rate and mean blood pressure in diabetic rats. The heart rate (A) and mean blood pressure (B) during the I/R period in control and diabetic rats were recorded. For chronic treatments, the animals were divided into three groups: control, age- and sex-matched normal rats, n = 16; STZ-vehicle, age- and sex-matched diabetic animals administered distilled water orally for 4 weeks starting 4 weeks after STZ induction, n = 13; and STZ-CAPA, CAPA 1 mg/kg administered orally once daily for 4 weeks starting 4 weeks after STZ induction, n = 6. BS 0, basal value just before ischemia; IS 45, 45 min after ischemia but just before reperfusion; RP 60, 60 min after reperfusion; RP 120, 120 min after reperfusion. Data are expressed as mean ± SEM. *P < 0.05 compared with control group and #P < 0.05 compared with STZ-vehicle group.
Figure 7
Figure 7
Effects of CAPA treatment on infarct size in diabetic rats. After I/R injury, area at risk (A) and infarct size/area at risk ratio (B) in diabetic rats were calculated. For chronic treatments, the animals were divided into three groups: control, age- and sex-matched normal rats, n = 16; STZ-vehicle, age- and sex-matched diabetic animals administered distilled water orally for 4 weeks starting 4 weeks after STZ induction, n = 13; and STZ-CAPA, CAPA 1 mg/kg administered orally once daily for 4 weeks starting 4 weeks after STZ induction, n = 6. Data are expressed as mean ± SEM. *P < 0.05 compared with control group and #P < 0.05 compared with STZ-vehicle group. BS 0, basal value just before ischemia; IS 45, 45 min after ischemia but just before reperfusion; RP 60, 60 min after reperfusion; RP 120, 120 min after reperfusion.
Figure 8
Figure 8
Representative pressure–volume loops during preload reduction before and after I/R in diabetic rats. The PV loops are derived from left ventricalar pressure (LVP) versus left ventricular volume (LVV) in the cardiac cycle diagram by transiently compressing the abdominal inferior vena cava before and after I/R. A-C, baseline PV loops before I/R; D-F, PV loops after I/R. Control (A, n = 16; and D, n = 6); diabetic rats administered vehicle (STZ-vehicle; B, n = 13; E, n = 6), diabetic rats administered CAPA (STZ-CAPA; C, n = 6; F, n = 5).
Figure 9
Figure 9
PV loop analysis before and after I/R in diabetic rats. The parameters of PV loop analysis are derived from LV pressure and LV volume. Ventricular contractility assessment is shown in maximum rising (+dP/dt, A) and falling (-dP/dt, B) velocity, left ventricular end systolic (LVESP, C) and end diastolic pressure (LVEDP, D) of the ventricular pressure that occurs during the cardiac cycle. E, ejection fraction (%). F, stroke volume. G, stroke work. Arterial elastance (Ea, H). End-systolic pressure volume relationship (ESPVR, I) and end-diastolic pressure volume relationship (EDPVR, J). Preload recruitable stroke work (PRSW, K). All values are represented as mean ± SEM before (baseline) and after I/R (I/R). *P < 0.05 compared to age- and sex-matched non-diabetic control rats. #P < 0.05 versus age- and sex-matched diabetic rats treated with vehicle.

Similar articles

Cited by

References

    1. Haffner SM, Lehto S, Ronnemaa T, Pyorala K, Laakso M. Mortality from coronary heart disease in subjects with type 2 diabetes and in nondiabetic subjects with and without prior myocardial infarction. N Engl J Med. 1998;339:229–234. doi: 10.1056/NEJM199807233390404. - DOI - PubMed
    1. Di Filippo C, Marfella R, Cuzzocrea S, Piegari E, Petronella P, Giugliano D, Rossi F, D'Amico M. Hyperglycemia in streptozotocin-induced diabetic rat increases infarct size associated with low levels of myocardial HO-1 during ischemia/reperfusion. Diabetes. 2005;54:803–810. doi: 10.2337/diabetes.54.3.803. - DOI - PubMed
    1. Marfella R, D'Amico M, Di Filippo C, Piegari E, Nappo F, Esposito K, Berrino L, Rossi F, Giugliano D. Myocardial infarction in diabetic rats: role of hyperglycaemia on infarct size and early expression of hypoxia-inducible factor 1. Diabetologia. 2002;45:1172–1181. doi: 10.1007/s00125-002-0882-x. - DOI - PubMed
    1. Simpson PJ, Lucchesi BR. Free radicals and myocardial ischemia and reperfusion injury. J Lab Clin Med. 1987;110:13–30. - PubMed
    1. Verma S, Fedak PW, Weisel RD, Butany J, Rao V, Maitland A, Li RK, Dhillon B, Yau TM. Fundamentals of reperfusion injury for the clinical cardiologist. Circulation. 2002;105:2332–2336. doi: 10.1161/01.CIR.0000016602.96363.36. - DOI - PubMed

Publication types

MeSH terms