. 2014 Jul;141(13):2644-56.
doi: 10.1242/dev.104380. Epub 2014 Jun 12.

Transcription factors involved in retinogenesis are co-opted by the circadian clock following photoreceptor differentiation

Affiliations

Transcription factors involved in retinogenesis are co-opted by the circadian clock following photoreceptor differentiation

Ricardo Laranjeiro et al. Development. 2014 Jul.

Abstract

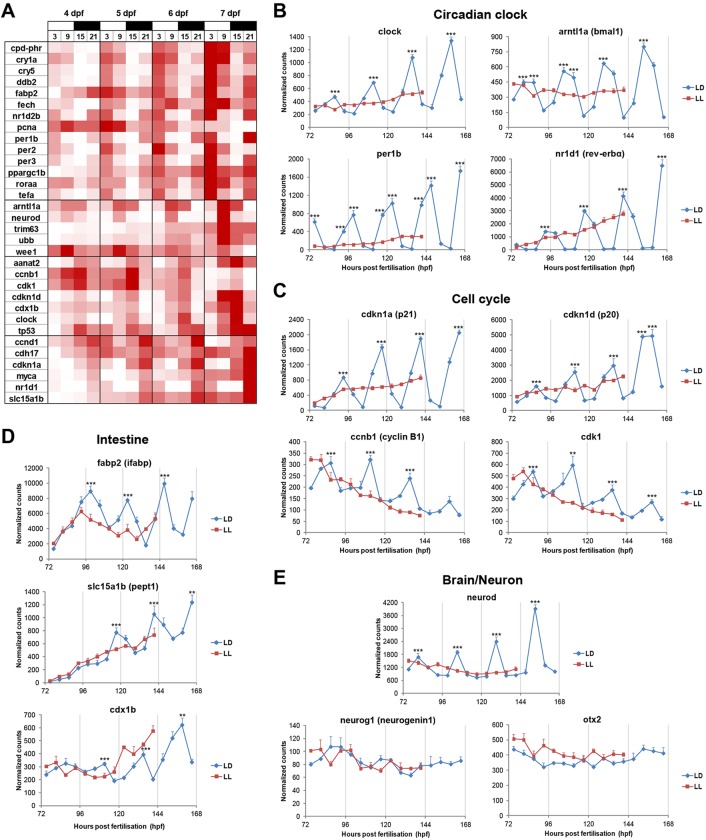
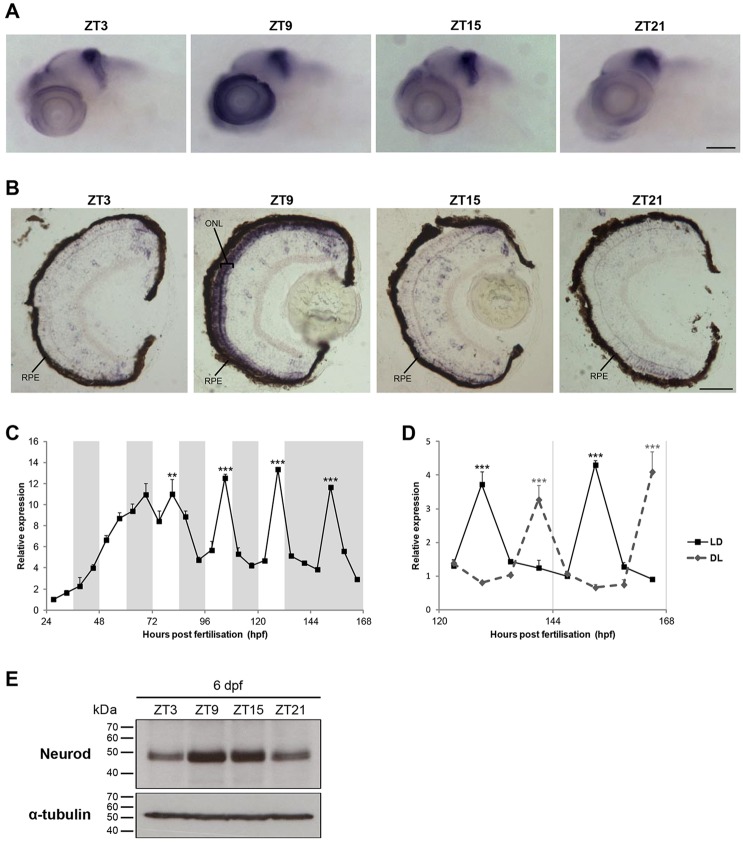
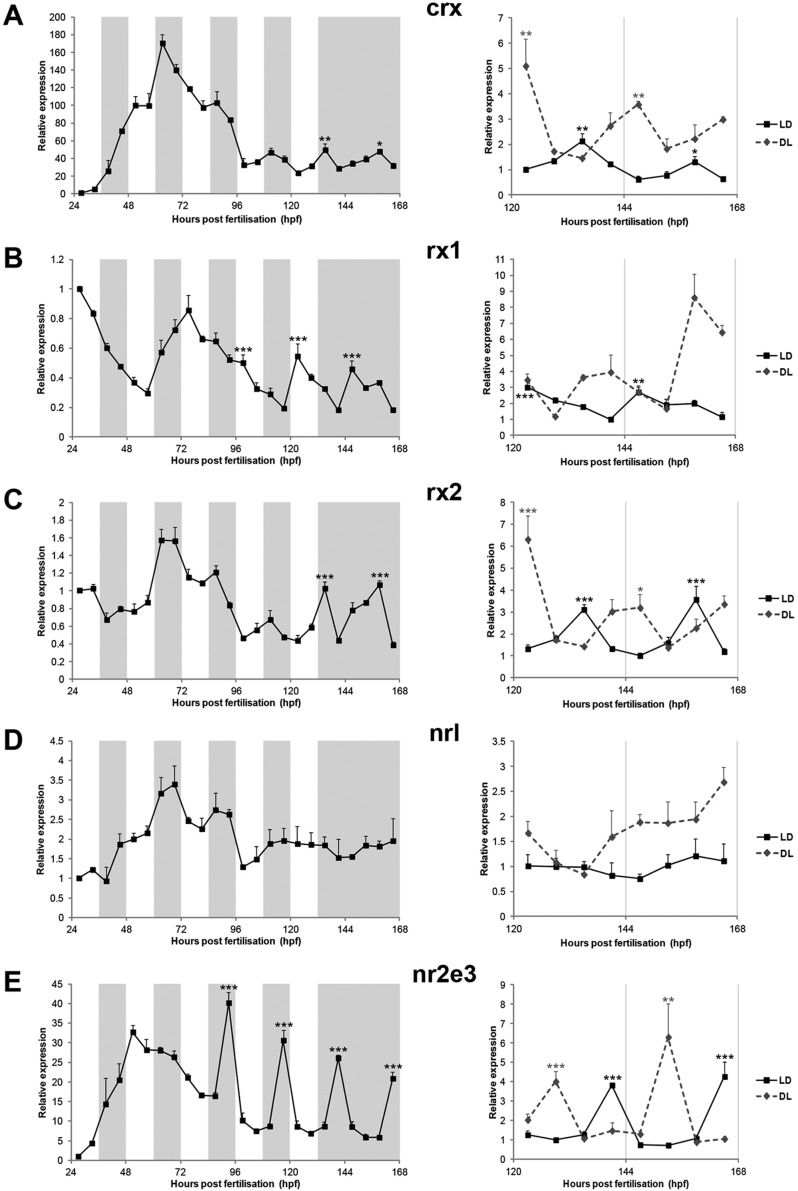
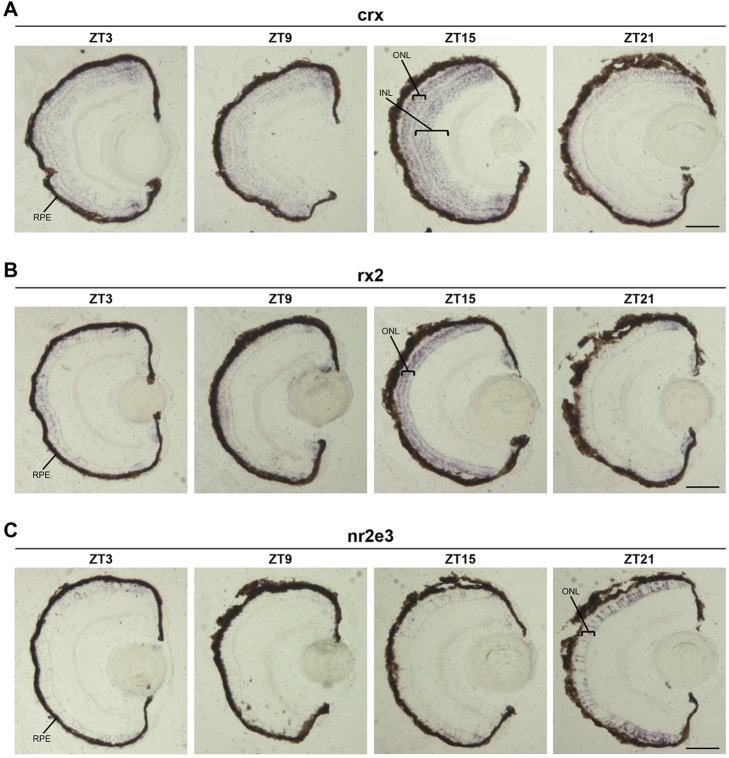
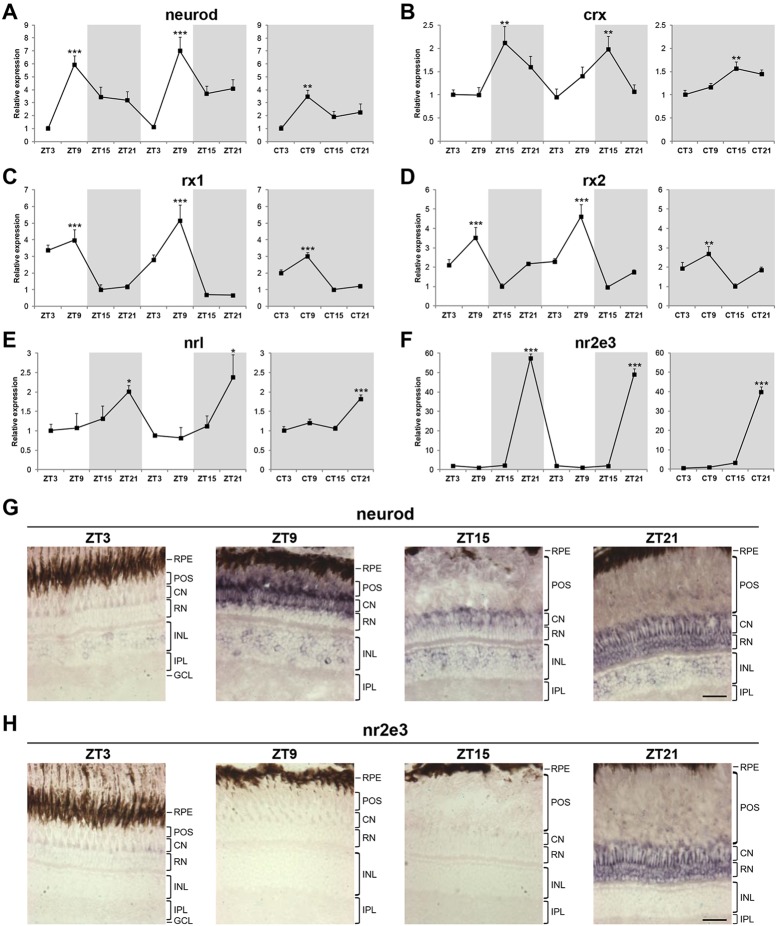
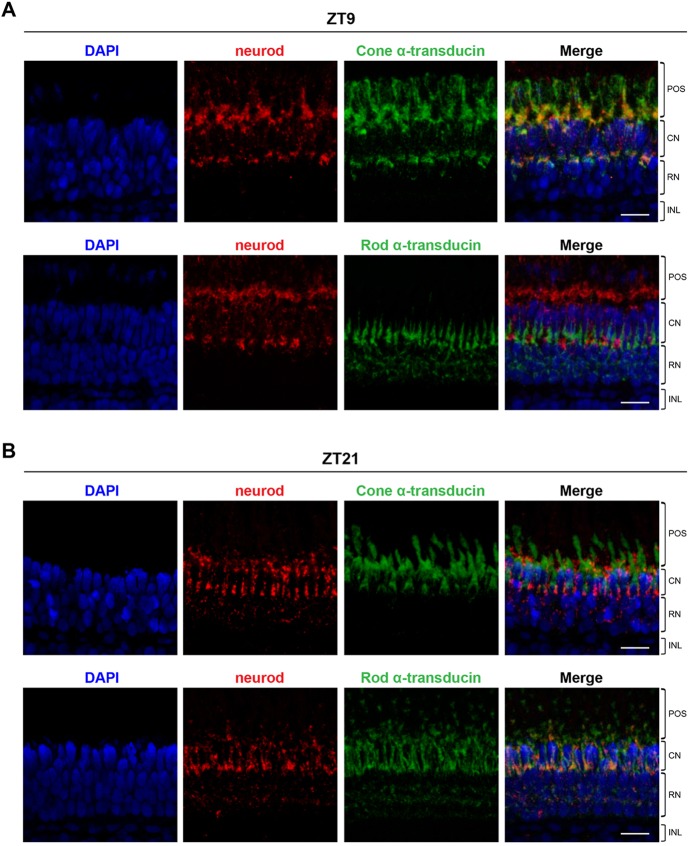
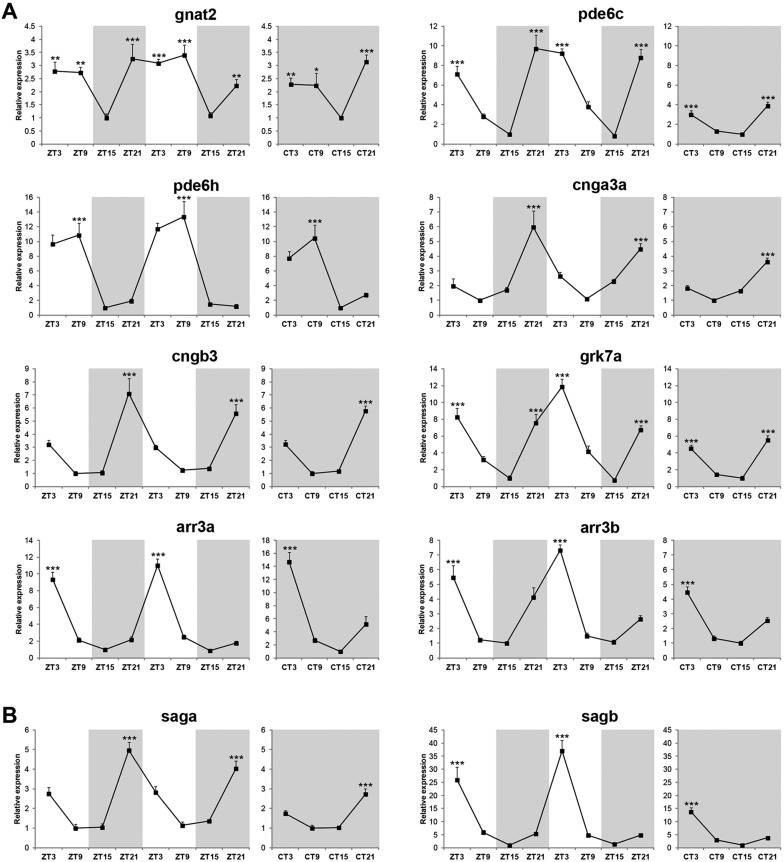
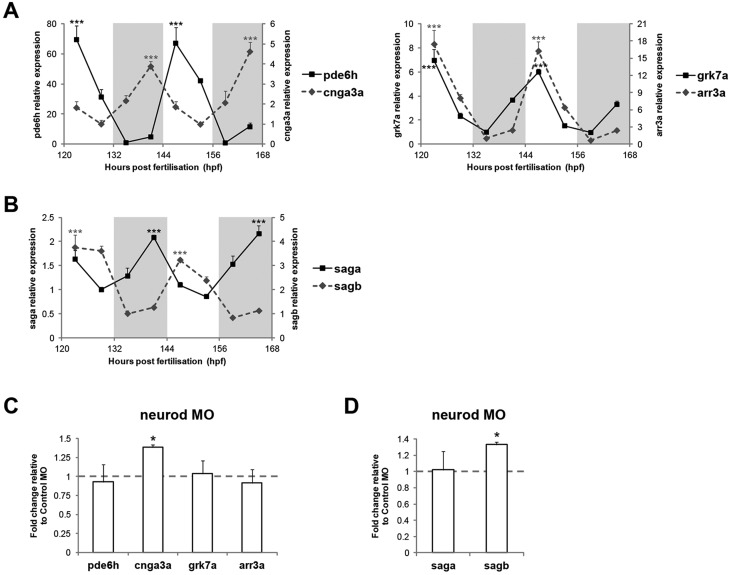
The circadian clock is known to regulate a wide range of physiological and cellular processes, yet remarkably little is known about its role during embryo development. Zebrafish offer a unique opportunity to explore this issue, not only because a great deal is known about key developmental events in this species, but also because the clock starts on the very first day of development. In this study, we identified numerous rhythmic genes in zebrafish larvae, including the key transcriptional regulators neurod and cdx1b, which are involved in neuronal and intestinal differentiation, respectively. Rhythmic expression of neurod and several additional transcription factors was only observed in the developing retina. Surprisingly, these rhythms in expression commenced at a stage of development after these transcription factors are known to have played their essential role in photoreceptor differentiation. Furthermore, this circadian regulation was maintained in adult retina. Thus, once mature photoreceptors are formed, multiple retinal transcription factors fall under circadian clock control, at which point they appear to play a new and important role in regulating rhythmic elements in the phototransduction pathway.

Keywords: Circadian clock; Photoreceptors; Retina; Transcription factors; Zebrafish; neurod.


Figures

Fig. 1.
Fig. 1.
Rhythmic gene expression during zebrafish larval development. (A) NanoString results summarised in a heat map, which includes all the genes that exhibited rhythmic expression on an LD cycle between 4 and 7 dpf (n=3). Expression values are presented in a colour range from white (lowest) to red (highest). Genes were grouped in four categories based on the time of day of their expression peak: ZT3, ZT9, ZT15 or ZT21 (from top to bottom, respectively). White and black bars above the heat map represent light and dark phases, respectively. (B-E) NanoString analysis of circadian clock (B), cell cycle (C), intestine (D) and brain/neuron (E) genes during zebrafish development (n=3). Gene expression on an LD cycle (4-7 dpf) was compared with that in LL conditions (4-6 dpf). Statistically significant differences between the expression peak and trough on each day (Fisher's LSD test) are indicated: **P<0.01, ***P<0.001. Error bars indicate s.e.m.
Fig. 2.
Fig. 2.
neurod rhythmic expression is restricted to retinal photoreceptors. (A,B) Representative images at four time points of neurod WISH on 6 dpf larvae (A) and of in situ hybridisation for neurod on 6 dpf larval eye sections (B). ZT, zeitgeber time; RPE, retinal pigment epithelium; ONL, outer nuclear layer. (C) qPCR analysis of neurod expression in zebrafish larvae raised on an LD cycle until 6 dpf and then transferred to DD on day 7 (n=3). White and grey backgrounds represent light and dark phases, respectively. (D) qPCR analysis of neurod expression in 6-7 dpf larvae raised on an LD cycle or a DL cycle (n=3). Statistically significant differences between the expression peak and trough on each day (Fisher's LSD test) are indicated: **P<0.01, ***P<0.001. Error bars indicate s.e.m. (E) Representative western blots of Neurod and α-tubulin expression on 6 dpf larvae at four time points. Scale bars: 100 µm in A; 50 µm in B.
Fig. 3.
Fig. 3.
Additional retinal transcription factors are rhythmically expressed during zebrafish development. (A-E) qPCR analysis of crx (A), rx1 (B), rx2 (C), nrl (D) and nr2e3 (E) expression during zebrafish development. Expression analysis was performed on larvae raised on an LD cycle until 6 dpf and then transferred to DD on day 7 (left) or on 6-7 dpf larvae raised either on an LD or a DL cycle (right) (n=3-5). White and grey backgrounds represent light and dark phases, respectively. Statistically significant differences between the expression peak and trough on each day (Fisher's LSD test) are indicated: *P<0.05, **P<0.01, ***P<0.001. Error bars indicate s.e.m.
Fig. 4.
Fig. 4.
Circadian expression of retinal transcription factors in differentiated photoreceptors. (A-C) Representative images of in situ hybridisation for crx (A), rx2 (B) and nr2e3 (C) on 6 dpf larval eye sections at four time points. RPE, retinal pigment epithelium; INL, inner nuclear layer; ONL, outer nuclear layer. Scale bars: 50 µm.
Fig. 5.
Fig. 5.
Circadian expression of retinal transcription factors is maintained in adult zebrafish. (A-F) qPCR analysis of neurod (A), crx (B), rx1 (C), rx2 (D), nrl (E) and nr2e3 (F) expression in adult eyes over two days of an LD cycle and one subsequent day of DD (n=3-4). Zeitgeber time (ZT) or circadian time (CT) indicates the four time points analysed per day. White and grey backgrounds represent light and dark phases, respectively. Statistically significant differences between the expression peak and trough on each day (Fisher's LSD test) are indicated: *P<0.05, **P<0.01, ***P<0.001. Error bars indicate s.e.m. (G,H) Representative images of in situ hybridisation for neurod (G) and nr2e3 (H) on adult eye sections at four time points. Note that expression in the photoreceptors at ZT21 is restricted to rods for both neurod and nr2e3. The signal present in the layer of cone nuclei corresponds to rod inner segments that connect the rod nuclei to the rod outer segments. RPE, retinal pigment epithelium; POS, photoreceptor outer segments; CN, cone nuclei; RN, rod nuclei; INL, inner nuclear layer; IPL, inner plexiform layer; GCL, ganglion cell layer. Scale bars: 30 µm.
Fig. 6.
Fig. 6.
Dynamic expression of neurod in zebrafish adult photoreceptors. Representative maximum projection confocal images of double fluorescent in situ hybridisation for neurod and cone α-transducin (gnat2) or neurod and rod α-transducin (gnat1) on adult eye sections at ZT9 (A) and ZT21 (B). DAPI was used as a nuclear counterstain. POS, photoreceptor outer segments; CN, cone nuclei; RN, rod nuclei; INL, inner nuclear layer. Scale bars: 15 µm.
Fig. 7.
Fig. 7.
Phototransduction genes are also rhythmically expressed in the zebrafish adult retina. qPCR analysis of cone-specific (A) and rod-specific (B) phototransduction genes in zebrafish adult eyes over two days of an LD cycle and one subsequent day of DD (n=3-4). Zeitgeber time (ZT) or circadian time (CT) indicates the four time points analysed per day. White and grey backgrounds represent light and dark phases, respectively. Statistically significant differences between the expression peak and trough on each day (Fisher's LSD test) are indicated: *P<0.05, **P<0.01, ***P<0.001. Error bars indicate s.e.m.
Fig. 8.
Fig. 8.
Regulation of phototransduction gene expression during zebrafish development. (A,B) qPCR analysis of cone-specific (A) and rod-specific (B) phototransduction genes on 6-7 dpf larvae raised on an LD cycle (n=3). White and grey backgrounds represent light and dark phases, respectively. Statistically significant differences between the expression peak and trough on each day (Fisher's LSD test) are indicated: ***P<0.001. (C,D) qPCR analysis of cone-specific (C) and rod-specific (D) phototransduction genes on 6 dpf larval eyes injected with neurod vivo-morpholino or control vivo-morpholino (n=3). Larval eyes were collected at ZT3 (C) or ZT15 (D). *P<0.05 (Student's t-test). Error bars indicate s.e.m.

Similar articles

Cited by

References

    1. Bernardos R. L., Barthel L. K., Meyers J. R., Raymond P. A. (2007). Late-stage neuronal progenitors in the retina are radial Muller glia that function as retinal stem cells. J. Neurosci. 27, 7028-7040 10.1523/JNEUROSCI.1624-07.2007 - DOI - PMC - PubMed
    1. Biehlmaier O., Neuhauss S. C. F., Kohler K. (2003). Synaptic plasticity and functionality at the cone terminal of the developing zebrafish retina. J. Neurobiol. 56, 222-236 10.1002/neu.10243 - DOI - PubMed
    1. Blader P., Fischer N., Gradwohl G., Guillemot F., Strahle U. (1997). The activity of neurogenin1 is controlled by local cues in the zebrafish embryo. Development 124, 4557-4569 - PubMed
    1. Branchek T., Bremiller R. (1984). The development of photoreceptors in the zebrafish, Brachydanio rerio. I. Structure. J. Comp. Neurol. 224, 107-115 10.1002/cne.902240109 - DOI - PubMed
    1. Carr A.-J. F., Whitmore D. (2005). Imaging of single light-responsive clock cells reveals fluctuating free-running periods. Nat. Cell Biol. 7, 319-321 10.1038/ncb1232 - DOI - PubMed

Publication types

MeSH terms