

Comment
doi: 10.1038/jid.2014.66.
RNA-seq permits a closer look at normal skin and psoriasis gene networks
Affiliations
- PMID: 24924757
- PMCID: PMC4058644
- DOI: 10.1038/jid.2014.66
Item in Clipboard
Comment
RNA-seq permits a closer look at normal skin and psoriasis gene networks
J Invest Dermatol.
2014 Jul.
Abstract
Psoriasis is a chronic inflammatory skin disease driven by aberrant signals from the immune system. In this issue, Li et al. present the first large RNA-seq analysis of gene expression in normal skin and psoriasis lesions, providing a more comprehensive view of mRNA expression than earlier microarray studies. This study's size enables gene co-expression analysis, a method illustrating which pathways are altered by the presence of disease.
Figures
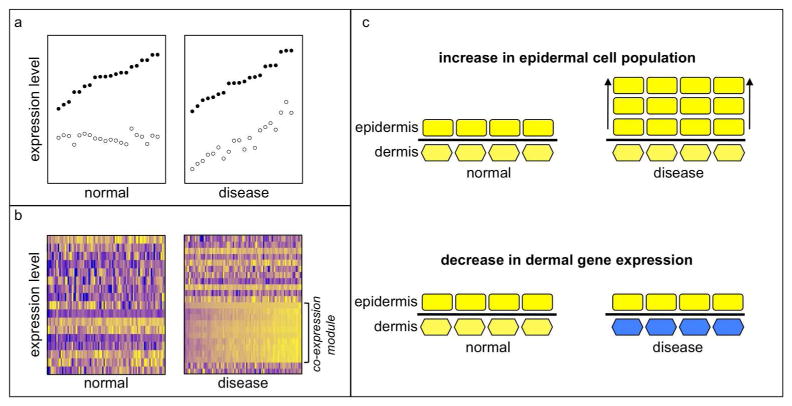
a) Expression levels of two hypothetical genes (solid and open circles) measured in normal and diseased tissue samples. Although each gene is expressed at the same level on average in both conditions, their expression levels are only correlated in disease. This relationship would not be evident from analysis of gene expression levels. b) Gene expression levels in normal and diseased tissue samples expressed as heat maps, with higher expression brighter yellow and lower expression darker blue. Correlation analysis can identify sets of genes that are significantly correlated with each other in only one state. These genes may be up-regulated, down-regulated, or not significantly different in expression levels. A decrease in gene expression between normal and diseased tissue can be complex to interpret when cell population proportions change. (c) In a schematic illustration, expansion of cells in the epidermis (rectangles) compared to cells in the dermis (hexagons) without a change in expression levels is illustrated at the top. A decrease in expression of dermal cells (colored blue, as in the heat map) without change in the relative cell population proportions is illustrated at the bottom. In both cases, the microarray will report a decrease in dermal gene expression relative to epidermal gene expression; additional analysis is required to understand to what extent each scenario applies.
Comment on
-
Transcriptome analysis of psoriasis in a large case-control sample: RNA-seq provides insights into disease mechanisms.J Invest Dermatol. 2014 Jul;134(7):1828-1838. doi: 10.1038/jid.2014.28. Epub 2014 Jan 17. J Invest Dermatol. 2014. PMID: 24441097 Free PMC article.
References
-
- Bowcock AM, Shannon W, Du F, et al. Insights into psoriasis and other inflammatory diseases from large-scale gene expression studies. Hum Mol Genet. 2001;10:1793–805. - PubMed
-
- Di Cesare A, Di Meglio P, Nestle FO. The IL-23/Th17 axis in the immunopathogenesis of psoriasis. J Invest Dermatol. 2009;129:1339–50. - PubMed
-
- Emilsson V, Thorleifsson G, Zhang B, et al. Genetics of gene expression and its effect on disease. Nature. 2008;452:423–8. - PubMed
Publication types
MeSH terms
Grants and funding
LinkOut - more resources
Full Text Sources
Other Literature Sources
Medical
