Review
. 2014 Jun;7(6):593-604.
doi: 10.1016/j.jcmg.2013.10.021.

Comparative definitions for moderate-severe ischemia in stress nuclear, echocardiography, and magnetic resonance imaging

Affiliations
Review

Comparative definitions for moderate-severe ischemia in stress nuclear, echocardiography, and magnetic resonance imaging

Leslee J Shaw et al. JACC Cardiovasc Imaging. 2014 Jun.

Erratum in

  • JACC Cardiovasc Imaging. 2014 Jul;7(7):748

Abstract

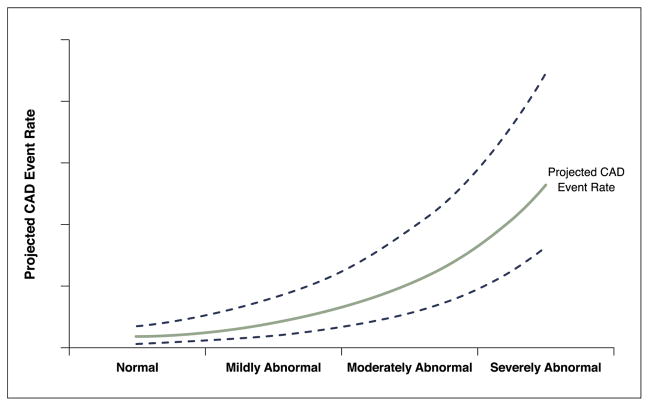
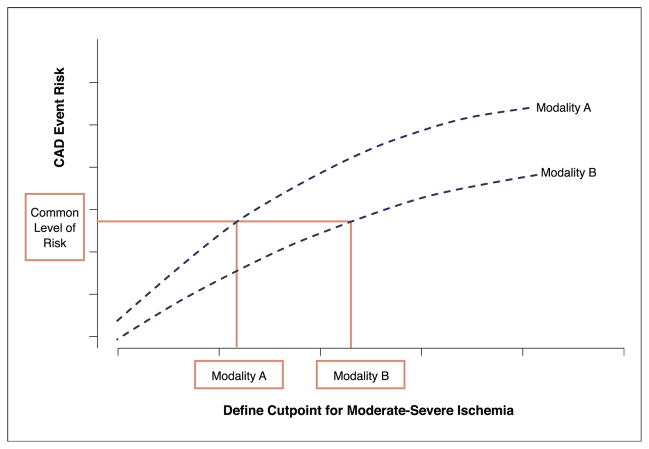
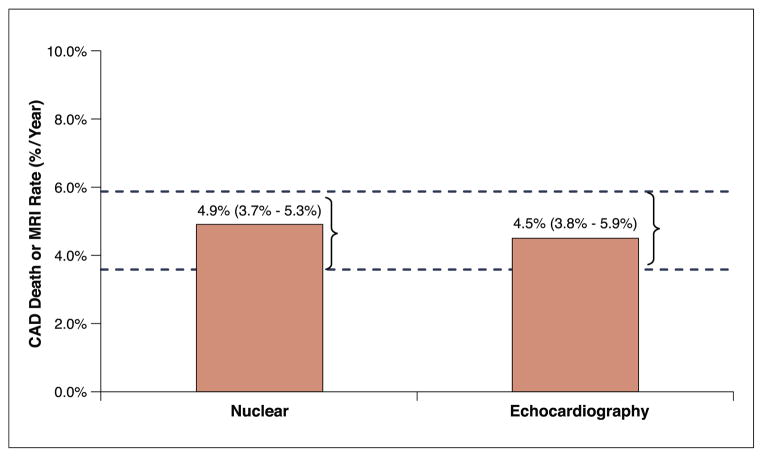
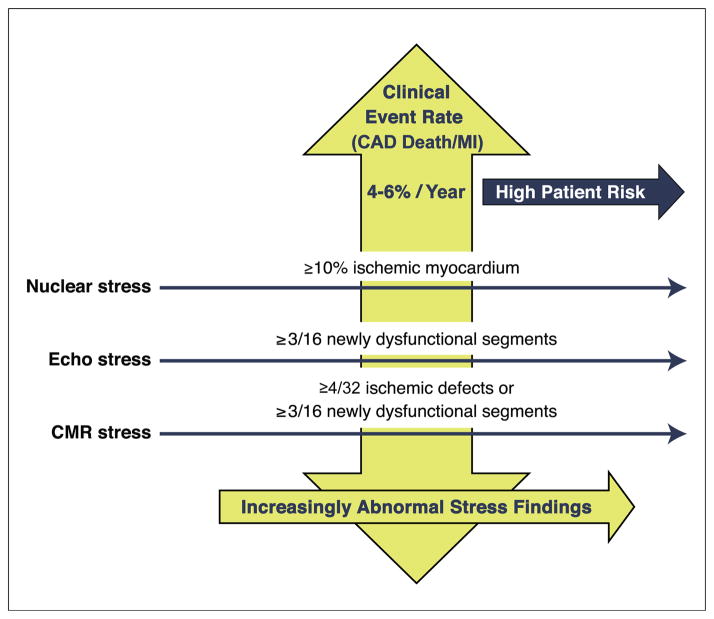
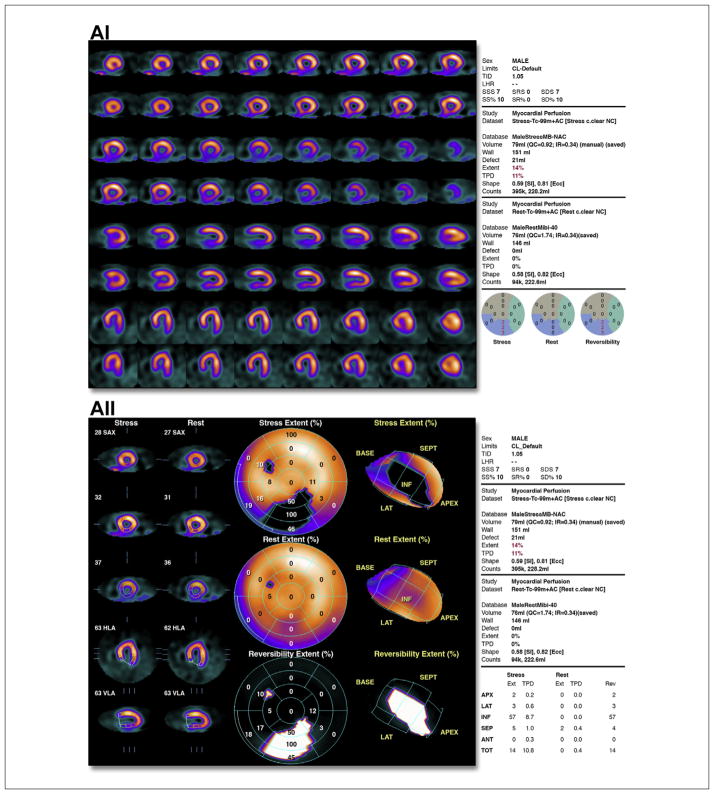
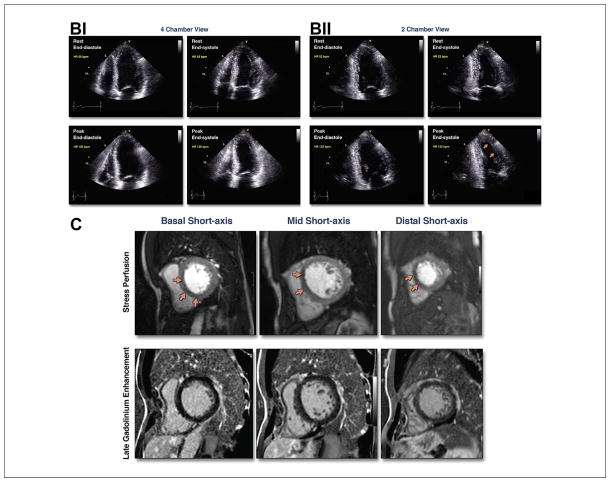
The lack of standardized reporting of the magnitude of ischemia on noninvasive imaging contributes to variability in translating the severity of ischemia across stress imaging modalities. We identified the risk of coronary artery disease (CAD) death or myocardial infarction (MI) associated with ≥10% ischemic myocardium on stress nuclear imaging as the risk threshold for stress echocardiography and cardiac magnetic resonance. A narrative review revealed that ≥10% ischemic myocardium on stress nuclear imaging was associated with a median rate of CAD death or MI of 4.9%/year (interquartile range: 3.75% to 5.3%). For stress echocardiography, ≥3 newly dysfunctional segments portend a median rate of CAD death or MI of 4.5%/year (interquartile range: 3.8% to 5.9%). Although imprecisely delineated, moderate-severe ischemia on cardiac magnetic resonance may be indicated by ≥4 of 32 stress perfusion defects or ≥3 dobutamine-induced dysfunctional segments. Risk-based thresholds can define equivalent amounts of ischemia across the stress imaging modalities, which will help to translate a common understanding of patient risk on which to guide subsequent management decisions.

Keywords: cardiac imaging; ischemia; prognosis.


Figures

Figure 1
Figure 1. Projected CAD Event Rates
A theoretical plot of the relationship between abnormal stress imaging findings and projected CAD events is shown. The lines include the average projected CAD event rate and 95% confidence intervals. As the stress imaging abnormalities become more extensive and severe, the projected CAD event rate increases. Conversely, for subsets with normal or mildly abnormal studies, the event rates are low. CAD = coronary artery disease.
Figure 2
Figure 2. Risk-Based Comparisons
A theoretical approach to comparing levels of moderate-severe ischemia across the stress imaging modalities is used to define similar CAD event rates. Abbreviation as in Figure 1.
Figure 3
Figure 3. Risk of CAD Death or MI for Moderate-Severe Ischemia
The median rates of CAD death or MI (%/year) on the basis of moderate-severe ischemia on stress nuclear myocardial perfusion imaging and stress echocardiography are shown. This narrative review highlights selected published evidence of rates of CAD death or MI for stress nuclear imaging and echocardiography; the dashed lines show the interquartile range of the CAD event rates (per year). The expected rate of CAD death or MI across all of the stress imaging modalities is ~4% to 6%/year. There are limitations to our median estimate, including that this was not a systematic review because of differential sample size, variable length of follow-up, and the use of mortality only or revascularization as an endpoint. MI = myocardial infarction; other abbreviation as in Figure 1.
Figure 4
Figure 4. Definitions of Moderate-Severe Ischemia
Comparable multimodality estimates of moderate-severe ischemia using risk-based thresholds of CAD death or MI rates of 4% to 6%/year. CMR = cardiac magnetic resonance; other abbreviations as in Figures 1 and 3.
Figure 5
Figure 5. Case Examples
(A) (i) Illustrative case of moderate ischemia with stress myocardial perfusion SPECT. Regadenoson stress (upper rows)/rest (lower rows) Tc-99m sestamibi SPECT images show moderate reduction of perfusion in the distal, mid, and basal inferior wall. Semiquantitative visual analysis (lower right polar maps) reveals 3 abnormal segments at stress with a total score of 7 and normal rest scores. The summed difference score is 7, representing 10% of the myocardium. (ii) Quantitative analysis of the case shown in i. Stress polar maps (middle column) reveal a perfusion defect (black area) on stress images (top) and normal rest images (middle). The TPD at stress is 11% and at rest is zero, indicating an ischemic TPD of 11%. (B) Illustrative case of moderate ischemia with stress echocardiography. Apical views from an exercise stress echocardiogram show moderate ischemia. Regional wall motion is normal at rest. At peak stress, wall motion abnormalities (severe hypokinesis) are observed in 3 segments: mid anterior, apical anterior, and apical lateral segments (arrows). See Online Videos 1, 2, 3, and 4. (C) Illustrative case of moderate ischemia with stress cardiac magnetic resonance perfusion imaging. The top row shows stress perfusion imaging, and the bottom row shows late gadolinium enhancement imaging of infarction. In both rows, basal short-axis locations are on the left, mid short-axis locations are in the middle, and distal short-axis locations are on the right. Note the spatial extent of the stress perfusion defect involving the basal anteroseptal (subendocardial) and inferoseptal (subendocardial and subepicardial), mid anteroseptal (subendocardial and subepicardial), and distal septal (subendocardial and subepicardial) walls. There are 7 subsegments of 32 demonstrated abnormal stress perfusion defects. None of these subsegments demonstrated evidence of infarction by late gadolinium enhancement imaging. This case illustrates a patient with moderate ischemia without infarction in the left anterior descending territory. SPECT = single-photon emission computed tomography; TPD = total perfusion deficit.

References

    1. Fihn SD, Gardin JM, Abrams J, et al. 2012 ACCF/AHA/ACP/AATS/PCNA/SCAI/STS guideline for the diagnosis and management of patients with stable ischemic heart disease. J Am Coll Cardiol. 2012;60:e44–164. - PubMed
    1. Hendel RC, Berman DS, Di Carli MF, et al. ACCF/ASNC/ACR/AHA/ASE/SCCT/SCMR/SNM 2009 appropriate use criteria for cardiac radionuclide imaging. J Am Coll Cardiol. 2009;53:2201–29. - PubMed
    1. Douglas PS, Khandheria B, Stainback RF, et al. ACCF/ASE/ACEP/AHA/ASNC/SCAI/SCCT/SCMR 2008 appropriateness criteria for stress echocardiography. J Am Coll Cardiol. 2008;51:1127–47. - PubMed
    1. Shaw LJ, Shaw RE, Merz CN, et al. Impact of ethnicity and gender differences on angiographic coronary artery disease prevalence and inhospital mortality in the american college of cardiology-national cardiovascular data registry. Circulation. 2008;117:1787–801. - PubMed
    1. Patel MR, Peterson ED, Dai D, et al. Low diagnostic yield of elective coronary angiography. N Engl J Med. 2010;362:886–95. - PMC - PubMed