Three-dimensional analysis of subchondral cysts in hip osteoarthritis: an ex vivo HR-pQCT study
- PMID: 24925444
- PMCID: PMC4125434
- DOI: 10.1016/j.bone.2014.06.001
Three-dimensional analysis of subchondral cysts in hip osteoarthritis: an ex vivo HR-pQCT study
Abstract
Introduction: Subchondral cysts are deeply related to the pathogenesis of osteoarthritis (OA), but the factors contributing to cyst formation are not well known. A three-dimensional analysis of subchondral cysts at the micro-structural level was conducted using a high-resolution peripheral quantitative CT (HR-pQCT), and their relationships with cartilage attrition and subchondral bone microstructure were investigated.
Methods: Femoral heads extracted from ten female patients with hip OA were scanned using an HR-pQCT at a voxel size of 41μm. The volume fractions, numbers, and sizes of the cysts were measured in the subchondral bone region under the area of cartilage loss. Furthermore, the areas of cartilage loss, as well as the microstructure of the subchondral bones, were also measured, and their correlations with the cysts were analyzed.
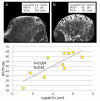
Results: The volume fractions of cysts within subchondral bone regions varied from 2% to 33%, the numbers of cysts varied from 6 to 87, and the sizes varied from 1mm(3) to 657mm(3). There was a positive correlation between the number of cysts and bone volume (r>0.8, p<0.01).
Conclusion: The degree of cyst formation showed a wide distribution in number and volume, and there was a close relationship between multiple cyst formation and bone sclerosis, which might be caused by reactive bone formation that occurred around each cyst.
Keywords: HR-pQCT; Microstructure; Osteoarthritis; Subchondral bone; Subchondral cyst.
Copyright © 2014 Elsevier Inc. All rights reserved.
Figures


References
-
- Lories RJ, Luyten FP. The bone–cartilage unit in osteoarthritis. Nat Rev Rheumatol. 2011 Jan 7;7(1):43–9. - PubMed
-
- Hayami T, Pickarski M, Zhuo Y, Wesolowski GA, Rodan GA, Duong LT. Characterization of articular cartilage and subchondral bone changes in the rat anterior cruciate ligament transection and meniscectomized models of osteoarthritis. Bone. 2006 Feb 1;38(2):234–43. - PubMed
-
- Hayami T, Pickarski M, Wesolowski GA, Mclane J, Bone A, Destefano J, et al. The role of subchondral bone remodeling in osteoarthritis: Reduction of cartilage degeneration and prevention of osteophyte formation by alendronate in the rat anterior cruciate ligament transection model. Arthritis Rheum. 2004 Apr 1;50(4):1193–206. - PubMed
-
- RHANEY K, LAMB DW. The cysts of osteoarthritis of the hip; a radiological and pathological study. J Bone Joint Surg Br. 1955 Nov 1;37-B(4):663–75. - PubMed
Publication types
MeSH terms
Grants and funding
LinkOut - more resources
Full Text Sources
Other Literature Sources
Medical

