A computational framework for heparan sulfate sequencing using high-resolution tandem mass spectra
- PMID: 24925905
- PMCID: PMC4159664
- DOI: 10.1074/mcp.M114.039560
A computational framework for heparan sulfate sequencing using high-resolution tandem mass spectra
Abstract
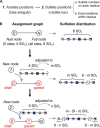
Heparan sulfate (HS) is a linear polysaccharide expressed on cell surfaces, in extracellular matrices and cellular granules in metazoan cells. Through non-covalent binding to growth factors, morphogens, chemokines, and other protein families, HS is involved in all multicellular physiological activities. Its biological activities depend on the fine structures of its protein-binding domains, the determination of which remains a daunting task. Methods have advanced to the point that mass spectra with information-rich product ions may be produced on purified HS saccharides. However, the interpretation of these complex product ion patterns has emerged as the bottleneck to the dissemination of these HS sequencing methods. To solve this problem, we designed HS-SEQ, the first comprehensive algorithm for HS de novo sequencing using high-resolution tandem mass spectra. We tested HS-SEQ using negative electron transfer dissociation (NETD) tandem mass spectra generated from a set of pure synthetic saccharide standards with diverse sulfation patterns. The results showed that HS-SEQ rapidly and accurately determined the correct HS structures from large candidate pools.
© 2014 by The American Society for Biochemistry and Molecular Biology, Inc.
Figures


Similar articles
-
Sequencing Heparan Sulfate Using HILIC LC-NETD-MS/MS.Anal Chem. 2019 Sep 17;91(18):11738-11746. doi: 10.1021/acs.analchem.9b02313. Epub 2019 Aug 29. Anal Chem. 2019. PMID: 31423779 Free PMC article.
-
Negative Electron Transfer Dissociation Sequencing of 3-O-Sulfation-Containing Heparan Sulfate Oligosaccharides.J Am Soc Mass Spectrom. 2018 Jun;29(6):1262-1272. doi: 10.1007/s13361-018-1907-0. Epub 2018 Mar 21. J Am Soc Mass Spectrom. 2018. PMID: 29564812 Free PMC article.
-
De Novo Sequencing of Complex Mixtures of Heparan Sulfate Oligosaccharides.Anal Chem. 2016 May 17;88(10):5299-307. doi: 10.1021/acs.analchem.6b00519. Epub 2016 Apr 27. Anal Chem. 2016. PMID: 27087275 Free PMC article.
-
Interactions between heparan sulfate and proteins-design and functional implications.Int Rev Cell Mol Biol. 2009;276:105-59. doi: 10.1016/S1937-6448(09)76003-4. Int Rev Cell Mol Biol. 2009. PMID: 19584012 Review.
-
Heparan Sulfate: Biosynthesis, Structure, and Function.Int Rev Cell Mol Biol. 2016;325:215-73. doi: 10.1016/bs.ircmb.2016.02.009. Epub 2016 Apr 13. Int Rev Cell Mol Biol. 2016. PMID: 27241222 Review.
Cited by
-
Glycosaminoglycanomics: where we are.Glycoconj J. 2017 Jun;34(3):339-349. doi: 10.1007/s10719-016-9747-2. Epub 2016 Nov 30. Glycoconj J. 2017. PMID: 27900575 Review.
-
Targeting heparin and heparan sulfate protein interactions.Org Biomol Chem. 2017 Jul 21;15(27):5656-5668. doi: 10.1039/c7ob01058c. Epub 2017 Jun 27. Org Biomol Chem. 2017. PMID: 28653068 Free PMC article. Review.
-
Ultra-high-performance liquid chromatography charge transfer dissociation mass spectrometry (UHPLC-CTD-MS) as a tool for analyzing the structural heterogeneity in carrageenan oligosaccharides.Anal Bioanal Chem. 2022 Jan;414(1):303-318. doi: 10.1007/s00216-021-03396-3. Epub 2021 May 29. Anal Bioanal Chem. 2022. PMID: 34050776
-
Preparation and characterization of heparin hexasaccharide library with N-unsubstituted glucosamine residues.Glycoconj J. 2015 Nov;32(8):643-53. doi: 10.1007/s10719-015-9612-8. Epub 2015 Aug 15. Glycoconj J. 2015. PMID: 26275985
-
Heparan sulfate glycomimetics via iterative assembly of "clickable" disaccharides.Chem Sci. 2023 Feb 28;14(13):3514-3522. doi: 10.1039/d3sc00260h. eCollection 2023 Mar 29. Chem Sci. 2023. PMID: 37006675 Free PMC article.
References
-
- Bishop J. R., Schuksz M., Esko J. D. (2007) Heparan sulphate proteoglycans fine-tune mammalian physiology. Nature 446, 1030–1037 - PubMed
-
- Parish C. R. (2006) The role of heparan sulphate in inflammation. Nat. Rev. Immunol. 6, 633–643 - PubMed
-
- Ori A., Wilkinson M., Fernig D. (2008) The heparanome and regulation of cell function: structures, functions, and challenges. Front. Biosci. J. Virtual Libr. 13, 4309 - PubMed
-
- Bülow H. E., Hobert O. (2006) The molecular diversity of glycosaminoglycans shapes animal development. Annu. Rev. Cell Dev. Biol. 22, 375–407 - PubMed
-
- Couchman J. R. (2010) Transmembrane signaling proteoglycans. Annu. Rev. Cell Dev. Biol. 26, 89–114 - PubMed
Publication types
MeSH terms
Substances
Grants and funding
LinkOut - more resources
Full Text Sources
Other Literature Sources

