. 2014 Jun 12;3(3):e000787.
doi: 10.1161/JAHA.114.000787.

A critical role for the vascular endothelium in functional neurovascular coupling in the brain

Affiliations

A critical role for the vascular endothelium in functional neurovascular coupling in the brain

Brenda R Chen et al. J Am Heart Assoc. .

Abstract

Background: The functional modulation of blood flow in the brain is critical for brain health and is the basis of contrast in functional magnetic resonance imaging. There is evident coupling between increases in neuronal activity and increases in local blood flow; however, many aspects of this neurovascular coupling remain unexplained by current models. Based on the rapid dilation of distant pial arteries during cortical functional hyperemia, we hypothesized that endothelial signaling may play a key role in the long-range propagation of vasodilation during functional hyperemia in the brain. Although well characterized in the peripheral vasculature, endothelial involvement in functional neurovascular coupling has not been demonstrated.

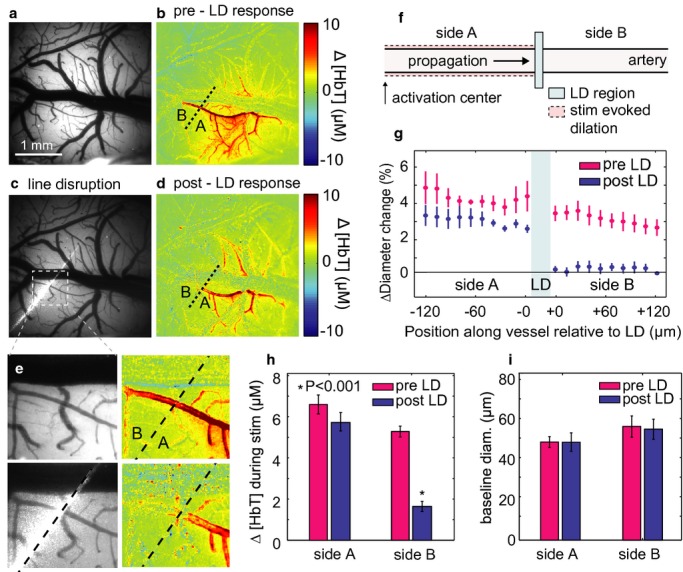
Methods and results: We combined in vivo exposed-cortex multispectral optical intrinsic signal imaging (MS-OISI) with a novel in vivo implementation of the light-dye technique to record the cortical hemodynamic response to somatosensory stimulus in rats before and after spatially selective endothelial disruption. We demonstrate that discrete interruption of endothelial signaling halts propagation of stimulus-evoked vasodilation in pial arteries, and that wide-field endothelial disruption in pial arteries significantly attenuates the hemodynamic response to stimulus, particularly the early, rapid increase and peak in hyperemia.

Conclusions: Involvement of endothelial pathways in functional neurovascular coupling provides new explanations for the spatial and temporal features of the hemodynamic response to stimulus and could explain previous results that were interpreted as evidence for astrocyte-mediated control of functional hyperemia. Our results unify many aspects of blood flow regulation in the brain and body and prompt new investigation of direct links between systemic cardiovascular disease and neural deficits.

Keywords: endothelial hyperpolarization; functional magnetic resonance imaging; neurovascular coupling; optical imaging; vascular endothelial function; vascular reactivity.


Figures

Figure 1.
Figure 1.
Normal spatiotemporal evolution of the hemodynamic response to somatosensory stimulation. a, Vascular organization of the cerebral cortex. Envisaged capillary hyperemia and retrograde dilation of penetrating arterioles and pial arteries feeding the active region is overlaid in red. b, Grayscale image of the exposed somatosensory cortical surface under 534 nm‐centered illumination with arrows indicating direction of blood flow (purple) and propagated vasodilation (red dash). c, Time courses of change in total hemoglobin (Δ[HbT]) extracted from regions of interest indicated in (a), (b) and (d) (average and SEM of N=10 repeated stimulus runs, same rat as in [b] and [d], and in Figure 3a through 3d). d (i through v), Time series of functional maps of Δ[HbT] after onset (at t=0) of 12‐second, 3‐Hz electrical hindpaw stimulation (same rat and field of view as in [b], averaged over times indicated, average of N=5 repeated stimulus runs). ΔHbT contrast shows both parenchymal hyperemia and the dilation of specific pial arteries. Arrowheads point to features described in the text. A indicates anterior; L, lateral; M, medial; P, posterior.
Figure 2.
Figure 2.
Light‐line disruption to endothelial propagation of vasodilation. a, Grayscale image of the exposed cortical surface (534 nm‐centered illumination). b, Pre‐light‐dye (LD) total hemoglobin (∆HbT) functional response map (averaged over 4 to 6 seconds after stimulus onset, stimulus duration=12 seconds, average of N=5 runs from 1 rat). c, Image of 488 nm laser focused into a “light‐line” positioned to transect a responding arteriole. d, Post‐LD hemodynamic response equivalent to (b), average of N=5 runs from 1 rat. The dilatory response no longer reaches side B. e, Zoomed in views of the region indicated in (c) for each case shown in (a) through (d). f, Schematic showing LD treatment geometry. g, Percent change in vessel diameter at the response peak (4 to 6 seconds) relative to baseline on either side of the LD‐treated vessel segment before (pink) and after (blue) LD treatment (average from n=3 rats, pre‐LD runs=5 per rat, post‐LD runs=5 per rat). Error bars: SEM. Position along the vessel is measured relative to the edges of the treated segment. The treated vessel segment was 83±15 μm long. h, Average ∆HbT 4 to 6 seconds after stimulus onset selected from side A and side B before (pink) and after (blue) LD treatment (n=4 rats, runs=20 per rat per condition). Side B shows significantly attenuated ∆HbT responses after LD treatment (P<0.001; Student t test). Error bars show SEs corrected for intraclass correlation. One rat included in ΔHbT analysis was excluded from diameter calculations owing to vessel overlap. i, Baseline vessel diameters on either side of the illuminated segment were unaffected by the LD treatment (n=3 rats, runs=15 per rat per condition: P>0.7, side A, P>0.9, side B; Student t test). Error bars show SEs corrected for intraclass correlation. Results from an additional light‐line rat with acetylcholine (ACh) control are shown in Figure 4.
Figure 3.
Figure 3.
The hemodynamic response before and after wide‐field light‐dye treatment. a, grayscale image of the exposed cortical surface (534 nm‐centered reflectance) of a representative rat (same rat as shown in Figure 1). b, Pre‐light‐dye treatment functional map showing total hemoglobin (∆[HbT]) “peak” response relative to baseline averaged over 4 to 6 seconds after stimulus onset (average of N=5 runs, 1 rat). c, Image showing the blue light spot used for wide‐field light‐dye treatment (≈1 mm in diameter). d, Post‐light‐dye ∆[HbT] functional map (same rat, time‐period average and color scale as [c]) (average of N=5 runs, 1 rat). e, Pre‐ and post‐light‐dye ∆[HbT] time‐course response to 12 seconds of stimulation averaged over n=7 rats, runs=5 per rat per condition, responses averaged per rat. Error bounds show SEM over rats. Responses to 2‐second stimulus are compared in Figure S3. Equivalent traces for oxy‐ and deoxy‐hemoglobin concentration changes are shown in Figure S3. The region of interest was the same for all conditions and was centered over the responding region and included both arteries and parenchyma. f, ∆[HbT] amplitudes response averaged over the “peak” (4 to 6 seconds) and “plateau” (10 to 12 seconds) shown as a percentage of the pre‐light‐dye “peak” response (data from e). Black dots: mean, boxes: SEM, whiskers: range of data. Post‐LD peak amplitude is significantly attenuated relative to pre‐LD (P<0.05; Student t test). g, Percent stimulus‐evoked change in diameter of responding pial arteries pre‐ and post‐light‐dye for “peak” and “plateau” (n=5 rats, 5 runs per rat per condition). Diameters calculated from averages of 5 runs=5 measurements per condition. Error bars show SEM. P values from Student t test.
Figure 4.
Figure 4.
Smooth muscle cell function and neural activity were unaltered by light‐dye treatment. a, Maximum Δ[HbT] change induced by topical cortical application of acetylcholine (ACh) (0.1 mmol/L) and sodium nitroprusside (SNP) (0.1 μmol/L) after wide‐field light‐dye (LD) treatment. LD values were extracted from within the treated blue light illumination area, whereas non‐light‐dye values were extracted from unilluminated, peripheral regions. Vasodilation to ACh in light‐dye–treated regions was significantly attenuated (**P<0.005; Student t test; n=3 rats, 2 trials per rat per condition). The temporal dynamics of dilation to SNP in light‐dye–treated and untreated regions were also unaffected (see Figure S6). b, Controls for 3 conditions: pre‐light‐dye response, response after exposure to blue light spot only (no dextran‐conjugated fluorescein isothiocyanate (FITC‐dx)), and response after FITC‐dx dye intravenous injection only (no blue light). Peak ∆[HbT] response was averaged over the hindpaw response region between 4 and 6 seconds after stimulus onset (n=4 rats, average of 15 runs per rat for each condition, responses were averaged over 5 runs in each rat=12 measurements per condition; error bars show SEM) (P>0.6 and P>0.7, respectively; Student t test). c through f, Light‐line ACh control. c, Peak Δ[HbT] map in response to 12‐second stimulation averaged over 4 to 6 seconds after stimulus onset (d) shows the subregion during light‐line illumination of a selected pial artery. e, ∆[HbT] images of same region of interest under 3 different conditions: (1) the peak response to stimulation before light‐line treatment (N=5 runs); (2) the peak response to stimulation after light‐line treatment (N=5 runs); and (3) The response of the same region (after light‐line treatment) to topical application of ACh (1 trial). Bar graphs show calculated percentage change in diameter on either side of the light line for these 3 conditions in the same rat (stimulus results show an average of 10 repeated runs; error bars show SEM) *P<0.05; Student t test. f, Electrophysiological recordings of neural activity during 12 seconds of hindpaw stimulation before and after wide‐field LD treatment. Black time course represents the average over n=2 rats, with runs=5 per rat per condition. Gray envelope indicates SEM. g, Averaged individual local field potential (LFP) spikes from the time courses in (f). Shaded region shows SEM.
Figure 5.
Figure 5.
Incorporating the vascular endothelium into neurovascular coupling (adapted from refs. and ). Astrocyte: hypothesized to sense glutamate through metabotropic glutamate receptors (mGluR), increasing intracellular calcium [Ca2+]ia and generating arachidonic acid (AA) from phospholipase A2 (PLA2) which is converted by COX1 (or 3) to prostaglandins (PG) and by P450 epoxygenase to epoxy‐eicosatrienoic acid (EETs)., Both PGs and EETs can relax smooth muscle cells (SMCs). Endothelial cells can increase their intracellular calcium [Ca2+]ie in response to receptor (R) binding (targets include acetylcholine (ACh), bradykinin (BK), adenosine triphosphate (ATP), adenosine diphosphate (ADP), uridine triphosphate (UTP), and adenosine,–) causing inositol triphosphate (IP3)‐mediated release of calcium from the endothelial endoplasmic reticulum (ER). Phospholipase C (or PLA2), through diacyl‐glycerol (DAG), can also produce EETs and AA derivatives, including prostacyclin (PGI2) within endothelial cells, both of which can drive SMC relaxation whereas increased [Ca2+]ie can also drive production of endothelial nitric oxide (NO), which can also relax SMCs. [Ca2+]ie increases can also lead to endothelial hyperpolarization through opening of calcium‐dependent potassium channels (KCa). Endothelial hyperpolarization can spread rapidly to adjacent endothelial cells through gap junctions and is coupled to encircling SMCs either through myoendothelial gap junctions (MEGJs) or some other “endothelium‐derived hyperpolarizing factor” (EDHF). SMC hyperpolarization causes relaxation through closure of voltage‐dependent calcium channels (Cav). Signaling from excitatory and inhibitory cortical neurons as well as afferents from regions such as the thalamus, basal forebrain, and locus coeruleus, to astrocytes, pericytes, SMCs have also been proposed., Potential signaling pathways, yet identified, are indicated by question (?) marks, and include the possibility of signalling between astrocytes, pericytes and endothelial cells, or even direct neuronal signalling to the vascular endothelium at the capillary level.

References

    1. Sirotin YB, Hillman EMC, Bordier C, Das A. Spatiotemporal precision and hemodynamic mechanism of optical point spreads in alert primates. Proc Natl Acad Sci USA. 2009; 106:18390-18395. - PMC - PubMed
    1. Attwell D, Iadecola C. The neural basis of functional brain imaging signals. Trends Neurosci. 2002; 25:621-625. - PubMed
    1. D'Esposito M, Deouell LY, Gazzaley A. Alterations in the BOLD fMRI signal with ageing and disease: a challenge for neuroimaging. Nat Rev Neurosci. 2003; 4:863-872. - PubMed
    1. Girouard H, Iadecola C. Neurovascular coupling in the normal brain and in hypertension, stroke, and Alzheimer disease. J Appl Physiol. 2006; 100:328-335. - PubMed
    1. Iadecola C. The pathobiology of vascular dementia. Neuron. 2013; 80:844-866. - PMC - PubMed

Publication types