. 2014 Jul;9(7):998-1007.
doi: 10.1097/JTO.0000000000000202.

Frequent coamplification and cooperation between C-MYC and PVT1 oncogenes promote malignant pleural mesothelioma

Affiliations

Frequent coamplification and cooperation between C-MYC and PVT1 oncogenes promote malignant pleural mesothelioma

Erick Riquelme et al. J Thorac Oncol. 2014 Jul.

Abstract

Introduction: Malignant pleural mesothelioma (MPM) is a deadly disease with poor prognosis and few treatment options. We characterized and elucidated the roles of C-MYC and PVT1 involved in the pathogenesis of MPM.

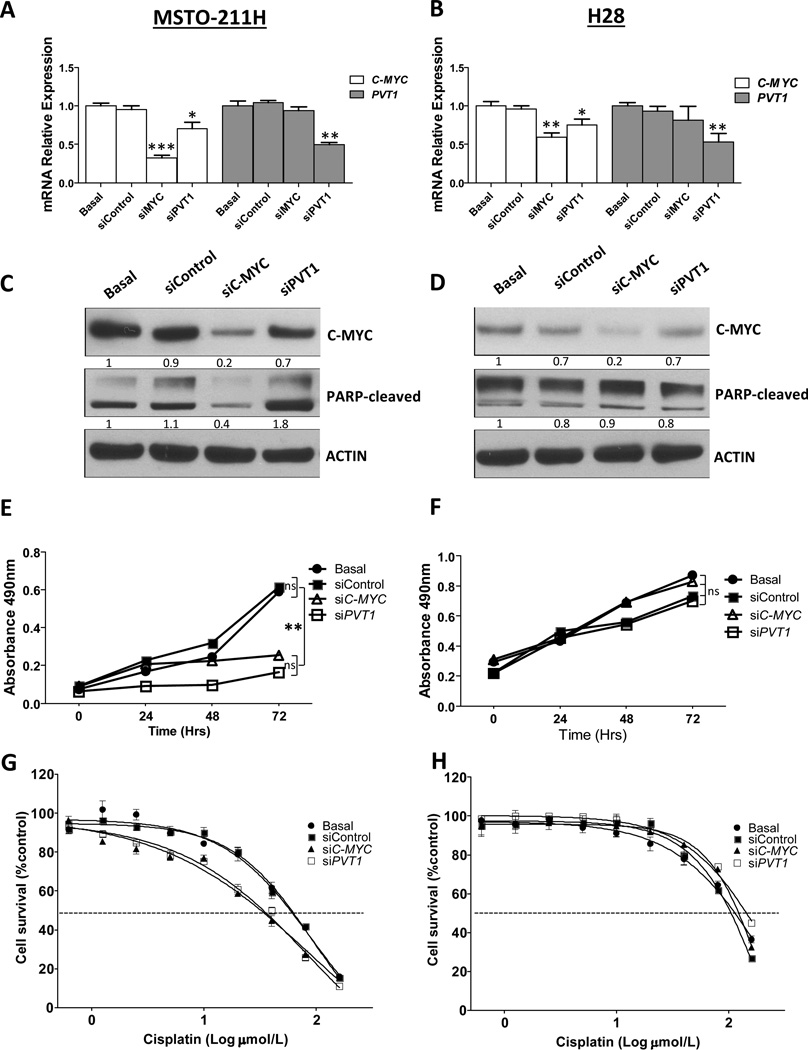
Methods: We used small interfering RNA (siRNA)-mediated knockdown in MPM cell lines to determine the effect of C-MYC and PVT1 abrogation on MPM cells undergoing apoptosis, proliferation, and cisplatin sensitivity. We also characterized the expression of microRNAs spanning the PVT1 region in MPM cell lines. Copy number analysis was measured by quantitative polymerase chain reaction and fluorescence in situ hybridization.

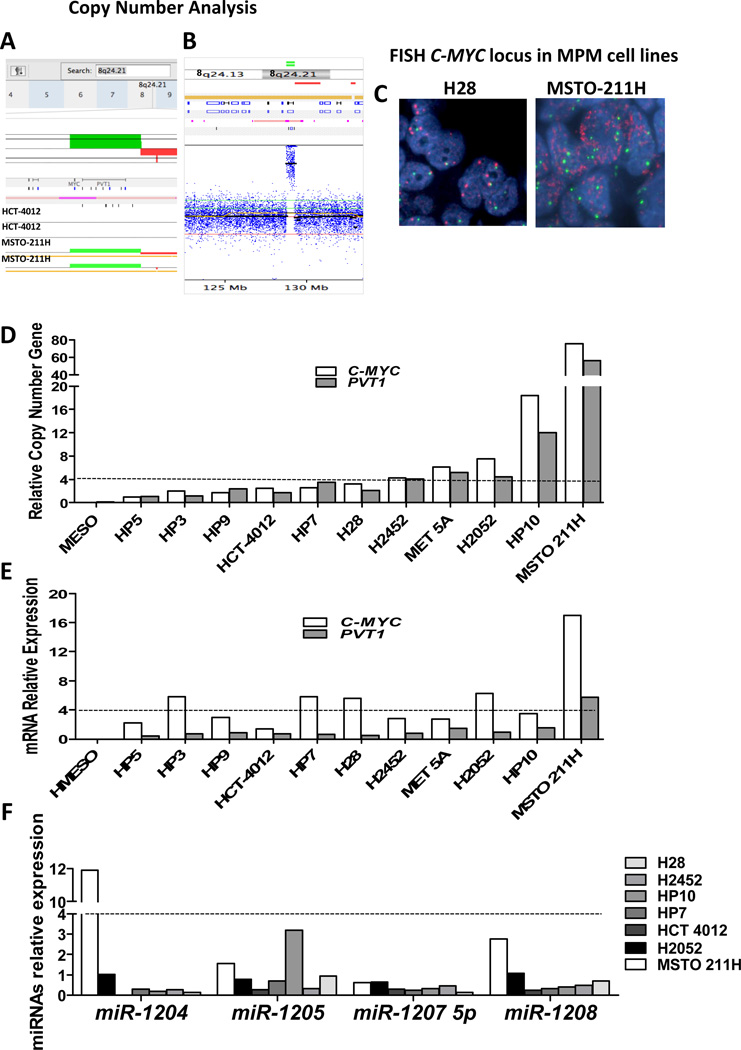
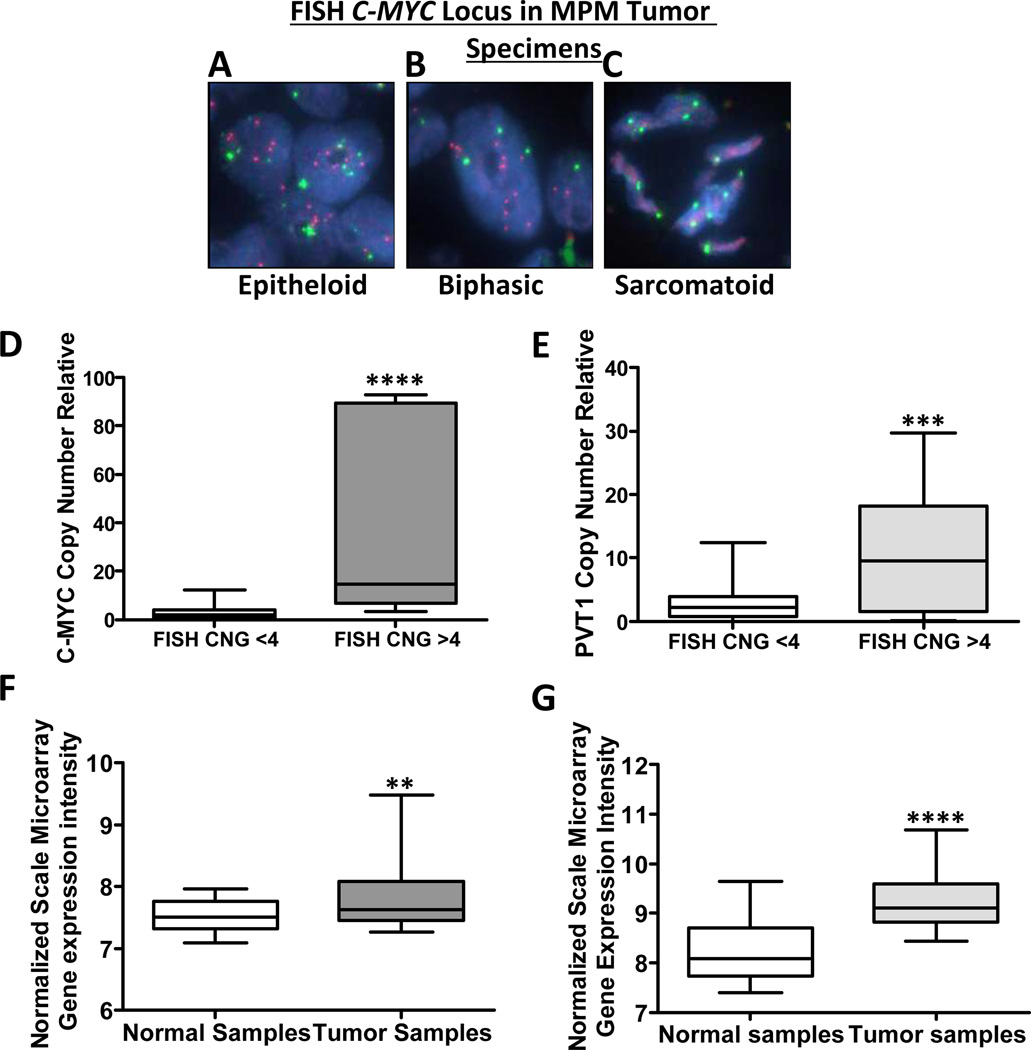
Results: Copy number analysis revealed copy number gains (CNGs) in chromosomal region 8q24 in six of 12 MPM cell lines. MicroRNA analysis showed high miR-1204 expression in MSTO-211H cell lines with four copies or more of PVT1. Knockdown by siRNA showed increased PARP-C levels in MSTO-211H transfected with siPVT1 but not in cells transfected with siC-MYC. C-MYC and PVT1 knockdown reduced cell proliferation and increased sensitivity to cisplatin. Analysis of the expression of apoptosis-related genes in the MSTO-211H cell line suggested that C-MYC maintains a balance between proapoptotic and antiapoptotic gene expression, whereas PVT1 and, to a lesser extent, miR-1204 up-regulate proapoptotic genes and down-regulate antiapoptotic genes. Fluorescence in situ hybridization analysis of MPM tumor specimens showed a high frequency of both CNGs (11 of 75) and trisomy (three copies; 11 of 75) for the C-MYC locus.

Conclusion: Our results suggest that C-MYC and PVT1 CNG promotes a malignant phenotype of MPM, with C-MYC CNG stimulating cell proliferation and PVT1 both stimulating proliferation and inhibiting apoptosis.


Conflict of interest statement

Disclosure of Potential Conflicts of Interest: No potential conflicts of interest were disclosed

Figures

Figure 1
Figure 1
C-MYC locus amplification is observed in malignant pleural mesothelioma (MPM) cell lines but not in normal mesothelial cell lines. A, SNP/Copy number analysis by Nexus 5.1 software showed amplification (represented as green bars) of chromosomal region 8q24.21, which contains the oncogene C-MYC. Duplicate samples of MPM cell line MSTO-211H were compared to normal cell line HCC-4012. B, Copy number analysis by Nexus 5.1 software showed C-MYC locus amplification in a representative sample of the MSTO-211H cell line. C, Representative examples of C-MYC copy number examined by FISH in MPM cell lines. (a) An H28 specimen shows no copy number gain (CNG). (b) An MSTO-211H specimen shows CNG. Red signals represent the C-MYC gene probe, whereas green signals represent the internal control probe (magnification 1,000×). D, q-PCR analysis of C-MYC and PVT1 CNG in MPM cell lines. E, Relative expression of C-MYC and PVT1 mRNA by qRT-PCR in MPM cell lines showed increased levels (i.e., ≥4-fold changes) of C-MYC gene expression in five MPM cell lines (HP3, HP7, H28, H2052, and MSTO-211H) and only the MSTO-211H cell line showed an increased level of PVT1 gene expression (≥4-fold change). F, Relative expression of miRNAs by qRT-PCR in MPM cell lines showed expression of miR-1204, -1205, -1207-5p, and -1208 in all seven MPM cell lines expression of miR-1204, -1205, -1207-5p, and -1208 in all seven MPM cell lines and not detect miR-1206 or miR-1207-3p expression in any of the cell lines tested.
Figure 2
Figure 2
Knockdown of C-MYC and PVT1 by siRNA decreased expression of C-MYC and PVT1, increased sensitivity to cisplatin, and reduced cell proliferation in malignant plural mesothelioma (MPM) cell lines. A, qRT-PCR analisys of C-MYC and PVT1 expression showed decreased C-MYC and PVT1 expression after knockdown of C-MYC and PVT1 by siRNAs in the MSTO-211H cell line. B, H28 MPM cell lines showed decreased C-MYC and PVT1 expression after knockdown of C-MYC and PVT1 by siRNAs. ***p < 0.001, ** p < 0.01, * p < 0.05. C, Western blot analysis of C-MYC and PARP-C expression after knockdown of C-MYC and PVT1 in MST0-211H cell lines showed decreased expression of C-MYC and increased PARP-C levels. D, Knockdown of C-MYC and PVT1 by siRNAs in H28 MPM cell lines showed decreased expression of C-MYC, and not detect changes in PARP-C levels when knocked down C-MYC and PVT1 in the H28 cell line E, Knockdown of C-MYC and PVT1 significantly reduced cell proliferation in MSTO-211H. **p < 0.01. F, However, proliferation was not reduced in H28 MPM cell lines. G, Knockdown of C-MYC and PVT1 by siRNA caused a 1.9-fold (p < 0.05) and 1.7-fold (p < 0.05) decrease in the cisplatin IC50 in MSTO-211H cell lines. H, However, knockdown did not cause cisplatin IC50 to decreasein H28 MPM cell lines. MPM cells subjected to gene-specific siRNA experiments were compared with control siRNA-transfected and nontransfected cells.
Figure 3
Figure 3
Malignant plural mesothelioma (MPM) tumor tissue specimens show C-MYC and PVT1 locus–specific copy number gain (CNG) and high expression of C-MYC and PVT1. Representative examples of C-MYC CNG examined by Fluorescence in situ hybridization (FISH) in MPM tissue specimens show high frequency of CNGs. FISH analysis shows, A, CNGs in epithelioid MPM. B, CNGs in biphasic MPM. C, no CNG in sarcomatoid MPM. Red signals represent the C-MYC gene probe, whereas and green signals represent the internal control probe (magnification 1,000×). Real time quantitative PCR (q-PCR) analysis of CNG of C-MYC and PVT1 in MPM tumor specimens by compared with CNG by FISH shows a correlation between both approaches. D, The box plots depict relative CNG of C-MYC revealed by q-PCR in 11 MPM tumor cell lines with C-MYC CNG as established by FISH and 19 MPM tumor cell lines without C-MYC CNG as established by FISH. **** p < 0.0001. E, The box plots depict relative CNG of PVT1 by q-PCR in 11 MPM tumor cell lines with C-MYC CNG as established by FISH and 19 MPM tumor cell lines without C-MYC CNG as established by FISH. *** p < 0.001. Normalized mRNA expression analysis F, C-MYC and G, PVT1 transcript using Affymetrix U133 plus 2.0 chips in MPM tumor specimens compared with normal samples. **** p < 0.0001, ** p < 0.01.

Similar articles

Cited by

References

    1. Tsao AS, Wistuba I, Roth JA, et al. Malignant pleural mesothelioma. J Clin Oncol. 2009;27:2081–2090. - PMC - PubMed
    1. Weill H, Hughes JM, Churg AM. Changing trends in US mesothelioma incidence. Occup Environ Med. 2004;61:438–441. - PMC - PubMed
    1. Price B. Analysis of current trends in United States mesothelioma incidence. Am J Epidemiol. 1997;145:211–218. - PubMed
    1. Larson T, Melnikova N, Davis SI, et al. Incidence and descriptive epidemiology of mesothelioma in the United States, 1999–2002. Int J Occup Environ Health. 2007;13:398–403. - PubMed
    1. Carbone M, Kratzke RA, Testa JR. The pathogenesis of mesothelioma. Semin Oncol. 2002;29:2–17. - PubMed

Publication types

MeSH terms