. 2014 Jun 13;9(6):e99298.
doi: 10.1371/journal.pone.0099298. eCollection 2014.

N-octanoyl dopamine treatment of endothelial cells induces the unfolded protein response and results in hypometabolism and tolerance to hypothermia

Affiliations

N-octanoyl dopamine treatment of endothelial cells induces the unfolded protein response and results in hypometabolism and tolerance to hypothermia

Eleni Stamellou et al. PLoS One. .

Abstract

Aim: N-acyl dopamines (NADD) are gaining attention in the field of inflammatory and neurological disorders. Due to their hydrophobicity, NADD may have access to the endoplasmic reticulum (ER). We therefore investigated if NADD induce the unfolded protein response (UPR) and if this in turn influences cell behaviour.

Methods: Genome wide gene expression profiling, confirmatory qPCR and reporter assays were employed on human umbilical vein endothelial cells (HUVEC) to validate induction of UPR target genes and UPR sensor activation by N-octanoyl dopamine (NOD). Intracellular ATP, apoptosis and induction of thermotolerance were used as functional parameters to assess adaptation of HUVEC.

Results: NOD, but not dopamine dose dependently induces the UPR. This was also found for other synthetic NADD. Induction of the UPR was dependent on the redox activity of NADD and was not caused by selective activation of a particular UPR sensor. UPR induction did not result in cell apoptosis, yet NOD strongly impaired cell proliferation by attenuation of cells in the S-G2/M phase. Long-term treatment of HUVEC with low NOD concentration showed decreased intracellular ATP concentration paralleled with activation of AMPK. These cells were significantly more resistant to cold inflicted injury.

Conclusions: We provide for the first time evidence that NADD induce the UPR in vitro. It remains to be assessed if UPR induction is causally associated with hypometabolism and thermotolerance. Further pharmacokinetic studies are warranted to address if the NADD concentrations used in vitro can be obtained in vivo and if this in turn shows therapeutic efficacy.


Conflict of interest statement

Competing Interests: The authors have declared that no competing interests exist.

Figures

Figure 1
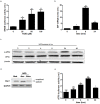
Figure 1. Induction of the UPR by NOD.
(a) HUVECs were transduced by lentiviral particles containing either an ERSE- luciferase reporter or a luciferase construct under control of a CMV driven promoter as transduction efficiency control. The cells were stimulated for 8 hrs with 25 µM, 50 µM and 100 µM of NOD as indicated. Luciferase activity was assessed as described in materials and methods and normalized for constitutively expressed luciferase. The results are expressed as normalized ESRE luciferase activity relative to untreated (0 µM) cells. Values represent mean ± SD from three independent experiments. *P<0.05, **P<0.01 vs. untreated control. (b) HUVECs were treated with 100 µM NOD for the indicated time periods. Total RNA was isolated and the expression of BiP and GAPDH was assessed by qPCR. The results are expressed as BiP mRNA levels, normalized for GAPDH and relative to cells that were not treated. *P<0.05, **P<0.01 vs. untreated control. (c) HUVECs were treated with 100 µM NOD for the indicated time periods. Hereafter protein extracts were made and phosphorylation of eIF2α was assessed by Western blotting. The blots were stripped and re-probed with antibodies directed against total eIF2α and β-actin to test for equal loading. The results of a representative blot are depicted, a total of 4 independent experiments were performed. (d) HUVECs were treated for 4 and 24 hrs with 100 µM of NOD before total RNA was isolated. Cells that were not treated (Med.) served as control. Spliced and unspliced xbp-1 mRNA were detected by PCR. The spliced and unspliced amplification products differ by 26 bp. (e) Cells were transduced with lentiviral particle containing an ATF-6-driven luciferase reporter or a luciferase construct under control of a CMV driven promoter as transduction efficiency control. The cells were stimulated for different time periods with NOD 100 µM. Luciferase activity was assesses as described in materials and methods and normalized for constitutively expressed luciferase. The results are expressed as normalized ATF6 luciferase activity relative to timepoint 0. Values represent mean ± SD from three independent experiments. **P<0.01, * P<0.05 vs. untreated control, ns: no significant.
Figure 2
Figure 2. Molecular structure of NADD used in the study.
Figure 3
Figure 3. Induction of the UPR by NADD variants.
(a) HUVECs were transduced by lentiviral particles containing either an ERSE- luciferase reporter or a luciferase construct under control of a CMV driven promoter as transduction efficiency control. The cells were stimulated for 8 hrs with 100 µM of different NADD as indicated. Equimolar concentrations of dopamine were also included to assess if dopamine induces the UPR. ERSE dependent luciferase activity was assessed as described in materials and methods and normalized for constitutively expressed luciferase. The results are expressed as normalized ESRE luciferase activity relative to untreated (Med.) cells. Values represent mean ± SD from three independent experiments, *P<0.05, **P<0.01 vs. untreated control, ns: not significant. (b) HUVECs were treated with 100 µM NADD for 8 hrs. Cells that were not treated (Med.) served as control. Hereafter total RNA was isolated and the expression of BiP and GAPDH were quantitated by qPCR. The results are expressed as BiP mRNA levels, normalized for GAPDH mRNA expression and relative to cells that were not treated (Med), *P<0.05, **P<0.01 vs. untreated control, ns: not significant. (c) HUVECs were stimulated for 8 hrs with 100 µM of different NADD, or left untreated (Med). Hereafter protein extracts were made and phosphorylation of eIF2α was assessed by Western blotting. The blots were stripped and re-probed with antibodies directed against total eIF2α and β-actin to test for equal loading. The results of a representative blot are depicted, a total of 4 independent experiments were performed. (d) HUVECs were stimulated for 8 hrs with different NADD (100 µM) before total RNA was isolated. Cells that were not treated (Med.) served as control. Spliced and unspliced xbp-1 mRNA were detected by PCR. The spliced and unspliced amplification products differ by 26 bp. (e) Cells were transduced with lentiviral particle containing an ATF-6-driven luciferase reporter or a constitutively expressed luciferase construct. The cells were stimulated for 8 hrs with different NADD (100 µM). Luciferase activity was assessed as described in materials and methods and normalized for constitutively expressed luciferase activity. The results are expressed as normalized ATF6 luciferase activity relative to untreated (Med.) cells. Values represent mean ± SD from three independent experiments, *P<0.05, **P<0.01, vs. untreated control, ns: no significant.
Figure 4
Figure 4. NOD inhibits PDI activity.
(a) PDI activity was assessed by monitoring PDI-catalyzed reduction of insulin in the presence of Dithiothreitol (DTT) and different concentrations of NOD. Bacitracin in concentrations of 1 and 10 mM was used to validate the assay. (b). Different NADD were tested for inhibition of PDI activity in a similar manner as described in (a). The results from three independent experiments are expressed as mean % PDI activity ± SD, using PDI activity in the absence of inhibitors (−) as 100%, *P<0.05, **P<0.01 vs. untreated control, ns: no significant.
Figure 5
Figure 5. NOD does not impair cell viability.
(a) HUVECs were treated for 24 hrs with NOD (100 µM) or tunicamycin (TM, 1 µg/ml). In addition cells were treated for 3 hrs with 100 µM of NOD prior to tunicamycin treatment. Cells that were not treated (Med.) served as control. Both floating and adherent cells were harvested, stained for Annexin V and 7-AAD and analysed by flow cytometry. (b) HUVECs were treated with 100 µM NOD or TM (1 µg/ml) for the indicated time periods. Total RNA was isolated and expression of CHOP mRNA was assessed by qPCR and normalized for GAPDH (left panel). Cells were pre-treated either with NOD or with tunicamycin and then chased for 0, 2, 4 and 8 hrs with AcD 50 ng/ml. Total RNA was isolated and the expression of CHOP (middle panel) and BiP (right panel) mRNA were assessed by qPCR and normalized for GAPDH. The results of three different experiments are expressed as mean mRNA levels ± SD, ** P<0.01 vs. untreated cells.
Figure 6
Figure 6. NOD inhibits cell proliferation.
(a) HUVECs were seeded in different cell densities in 96 well plates and the next day treated for 48 hrs with different concentrations of NOD. During the last 16 hrs the cells were pulsed with 0.2 µCi 3[H] thymidine and subsequently harvested. The results of a representative experiment are depicted and expressed as mean 3H-thymidine incorporation in counts per minute (cpm) ± SD of 6 replicate wells for each condition. A total of 6 experiments were performed with essentially similar results. Significance was defined as *P<0.05 and **P<0.01 compared to untreated cells, ns: not significant. (b) In separate experiments HUVECs were stimulated with 100 µM of NOD or left untreated. One part of the cells was used for cell cycle analysis, for the other part total RNA was isolated and the expression of AUROKA, CCNB1, CCNA2 and CDK1 was assessed by qPCR (c). A total of three experiments were performed. The results in graph (b) are expressed as mean percentage of cells in G0/1-, S- and G2/M- phase. *P<0.05, NOD vs. untreated. The results in graph (c) are expressed as normalized mRNA levels relative to the untreated medium control cells. ** P<0.01 vs. untreated control.
Figure 7
Figure 7. Long-term NOD treatment results in hypometabolism and thermotolerance.
Three different primary HUVEC isolations were cultured from P2 until P6 in the absence or presence of the indicated NOD concentrations. (a) BiP mRNA expression for cells cultured in the presence of 0.1 and 1 µM NOD was assessed by qPCR. (b) CHOP, BiP, PDI4, and ERO1L mRNA expression for cells cultured in the presence of 0.1 µM NOD was assessed by qPCR. The results in a and b are expressed as normalized mean mRNA levels relative to untreated controls (0, Med) ± SD of 3 replicates for each condition and for all 3 HUVEC isolations. ** P<0.01, *P<0.05 vs. untreated cells. (c) Intracellular ATP concentration was assessed in HUVEC at P6 upon long-term culture in the absence (medium) or presence of NOD (1 µM). The results are expressed as mean ATP concentration (pmol/5*105 cells) ± SD of 3 replicates for each condition and for all 3 HUVEC isolations. **P<0.01 vs. untreated cells (d,e). In separate experiments NOD (1 µM) containing medium was exchanged for normal cell culture medium at P6 and the cells were cultured for 2 (2d) or 5 (5d) days in the absence of NOD. Cells that were continuously cultured in normal cell culture medium (Med.) were used as control. In (d) protein extracts were made and assessed for phosphorylation of AMPK (p-AMPK) by Western blotting. The blots were stripped and re-probed with antibodies directed against β-actin to test for equal loading. The results of a representative blot are depicted, a total of 3 independent experiments were performed. In (e) the cells were subjected to cold storage (4°C) for 24 hrs. Hereafter LDH release was assessed in the supernatants. Each condition was tested in triplicate in 2 independent experiments. The results are expressed as mean LDH release (OD490) ± SD, **P<0.01 vs. (Med.) control.

References

    1. Schroder M, Kaufman RJ (2005) The mammalian unfolded protein response. Annu Rev Biochem 74: 739–789. - PubMed
    1. Samali A, Fitzgerald U, Deegan S, Gupta S (2010) Methods for monitoring endoplasmic reticulum stress and the unfolded protein response. Int J Cell Biol 2010: 830307. - PMC - PubMed
    1. Ron D, Walter P (2007) Signal integration in the endoplasmic reticulum unfolded protein response. Nat Rev Mol Cell Biol 8: 519–529. - PubMed
    1. Walter P, Ron D (2011) The unfolded protein response: from stress pathway to homeostatic regulation. Science 334: 1081–1086. - PubMed
    1. Kohno K (2010) Stress-sensing mechanisms in the unfolded protein response: similarities and differences between yeast and mammals. Journal of Biochemistry 147: 27–33. - PubMed

Publication types

MeSH terms