

Correlation of intra-tumor 18F-FDG uptake heterogeneity indices with perfusion CT derived parameters in colorectal cancer
- PMID: 24926986
- PMCID: PMC4057188
- DOI: 10.1371/journal.pone.0099567
Correlation of intra-tumor 18F-FDG uptake heterogeneity indices with perfusion CT derived parameters in colorectal cancer
Abstract
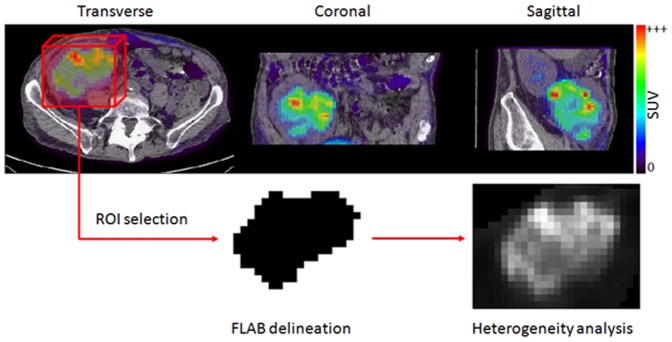
Methods: Thirty patients with proven colorectal cancer prospectively underwent integrated 18F-FDG PET/DCE-CT to assess the metabolic-flow phenotype. Both CT blood flow parametric maps and PET images were analyzed. Correlations between PET heterogeneity and perfusion CT were assessed by Spearman's rank correlation analysis.
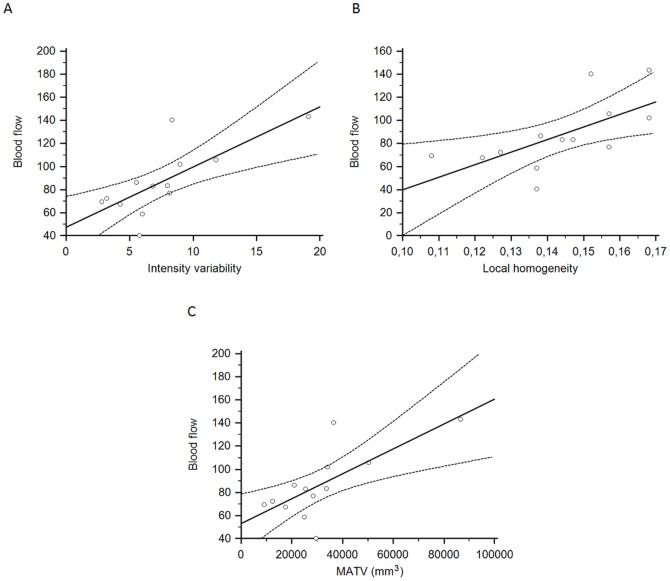
Results: Blood flow visualization provided by DCE-CT images was significantly correlated with 18F-FDG PET metabolically active tumor volume as well as with uptake heterogeneity for patients with stage III/IV tumors (|ρ|:0.66 to 0.78; p-value<0.02).
Conclusion: The positive correlation found with tumor blood flow indicates that intra-tumor heterogeneity of 18F-FDG PET accumulation reflects to some extent tracer distribution and consequently indicates that 18F-FDG PET intra-tumor heterogeneity may be associated with physiological processes such as tumor vascularization.
Conflict of interest statement
Figures
Similar articles
-
Characterization of tumor heterogeneity using dynamic contrast enhanced CT and FDG-PET in non-small cell lung cancer.Radiother Oncol. 2013 Oct;109(1):65-70. doi: 10.1016/j.radonc.2013.08.032. Epub 2013 Sep 14. Radiother Oncol. 2013. PMID: 24044795 Free PMC article.
-
Intra-tumour 18F-FDG uptake heterogeneity decreases the reliability on target volume definition with positron emission tomography/computed tomography imaging.J Med Imaging Radiat Oncol. 2015 Jun;59(3):338-45. doi: 10.1111/1754-9485.12289. Epub 2015 Feb 23. J Med Imaging Radiat Oncol. 2015. PMID: 25708154
-
Integrated (18)F-FDG PET/CT and perfusion CT of primary colorectal cancer: effect of inter- and intraobserver agreement on metabolic-vascular parameters.AJR Am J Roentgenol. 2012 Nov;199(5):1003-9. doi: 10.2214/AJR.11.7823. AJR Am J Roentgenol. 2012. PMID: 23096172
-
Positron emission tomography/computerized tomography functional imaging of esophageal and colorectal cancer.Cancer J. 2004 Jul-Aug;10(4):243-50. doi: 10.1097/00130404-200407000-00005. Cancer J. 2004. PMID: 15383205 Review.
-
Quantitative approaches of dynamic FDG-PET and PET/CT studies (dPET/CT) for the evaluation of oncological patients.Cancer Imaging. 2012 Sep 28;12(1):283-9. doi: 10.1102/1470-7330.2012.0033. Cancer Imaging. 2012. PMID: 23033440 Free PMC article. Review.
Cited by
-
AI-based applications in hybrid imaging: how to build smart and truly multi-parametric decision models for radiomics.Eur J Nucl Med Mol Imaging. 2019 Dec;46(13):2673-2699. doi: 10.1007/s00259-019-04414-4. Epub 2019 Jul 11. Eur J Nucl Med Mol Imaging. 2019. PMID: 31292700 Review.
-
Metabolic Imaging Phenotype Using Radiomics of [18F]FDG PET/CT Associated with Genetic Alterations of Colorectal Cancer.Mol Imaging Biol. 2019 Feb;21(1):183-190. doi: 10.1007/s11307-018-1225-8. Mol Imaging Biol. 2019. PMID: 29948642
-
A Study on the Basic Criteria for Selecting Heterogeneity Parameters of F18-FDG PET Images.PLoS One. 2016 Oct 13;11(10):e0164113. doi: 10.1371/journal.pone.0164113. eCollection 2016. PLoS One. 2016. PMID: 27736888 Free PMC article.
-
Do clinical, histological or immunohistochemical primary tumour characteristics translate into different (18)F-FDG PET/CT volumetric and heterogeneity features in stage II/III breast cancer?Eur J Nucl Med Mol Imaging. 2015 Oct;42(11):1682-1691. doi: 10.1007/s00259-015-3110-x. Epub 2015 Jul 4. Eur J Nucl Med Mol Imaging. 2015. PMID: 26140849 Free PMC article.
-
Prediction of Recurrence by Preoperative Intratumoral FDG Uptake Heterogeneity in Endometrioid Endometrial Cancer.Transl Oncol. 2017 Apr;10(2):178-183. doi: 10.1016/j.tranon.2017.01.002. Epub 2017 Feb 3. Transl Oncol. 2017. PMID: 28167243 Free PMC article.
References
-
- Tepper JE, O'Connell M, Niedzwiecki D, Hollis DR, Benson AB 3rd, et al. (2002) Adjuvant therapy in rectal cancer: analysis of stage, sex, and local control final report of intergroup 0114. J Clin Oncol 20: 1744–1750. - PubMed
-
- Hebertson RA, Scarsbrook AF, Lee ST, Tebbutt N, Scott AM (2009) Established, emerging and future roles of PET/CT in the management of colorectal cancer. Clinical radiology 64: 225–237. - PubMed
-
- Chowdhury FU, Shah N, Scarsbrook AF, Bradley KM (2010) [18F]FD PET/CT imaging of colorectal cancer: a pictorial review. Postgrad Med J 86: 174–182. - PubMed
Publication types
MeSH terms
Substances
LinkOut - more resources
Full Text Sources
Other Literature Sources
Medical
