. 2014 Nov;273(2):570-9.
doi: 10.1148/radiol.14130216. Epub 2014 Jun 12.

Idiopathic pulmonary fibrosis: CT and risk of death

Affiliations

Idiopathic pulmonary fibrosis: CT and risk of death

Brett Ley et al. Radiology. 2014 Nov.

Abstract

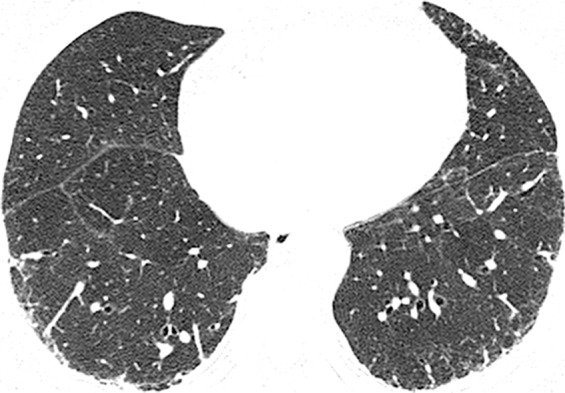
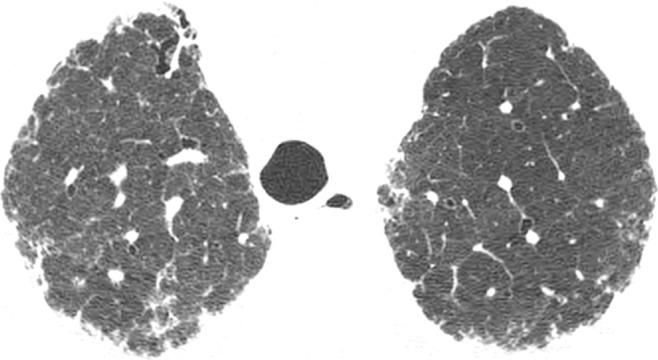
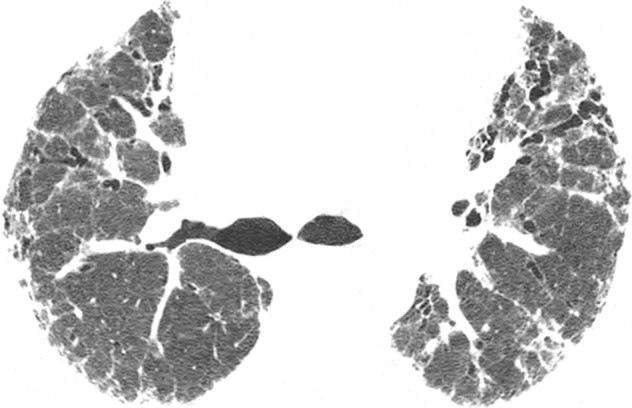
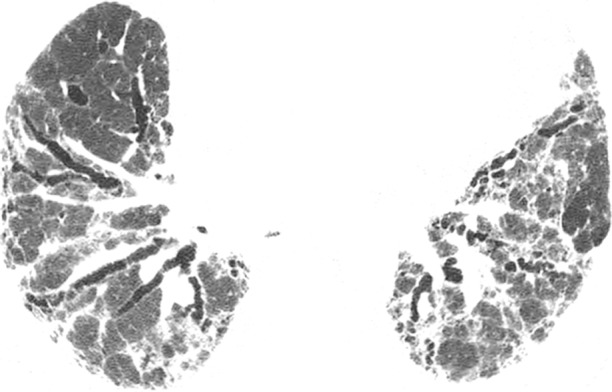
Purpose: To investigate the prognostic value of quantitative computed tomographic (CT) scoring for the extent of fibrosis or emphysema in the context of a clinical model that includes the gender, age, and physiology ( GAP gender, age, and physiology model) of the patient.

Materials and methods: Study cohorts were approved by local institutional review boards, and all patients provided written consent. This was a retrospective cohort study that included 348 patients (246 men, 102 women; mean age, 69 years ± 9) with idiopathic pulmonary fibrosis from two institutions. Fibrosis and emphysema visual scores were independently determined by two radiologists. Models were based on competing risks regression for death and were evaluated by using the C index and reclassification improvement.

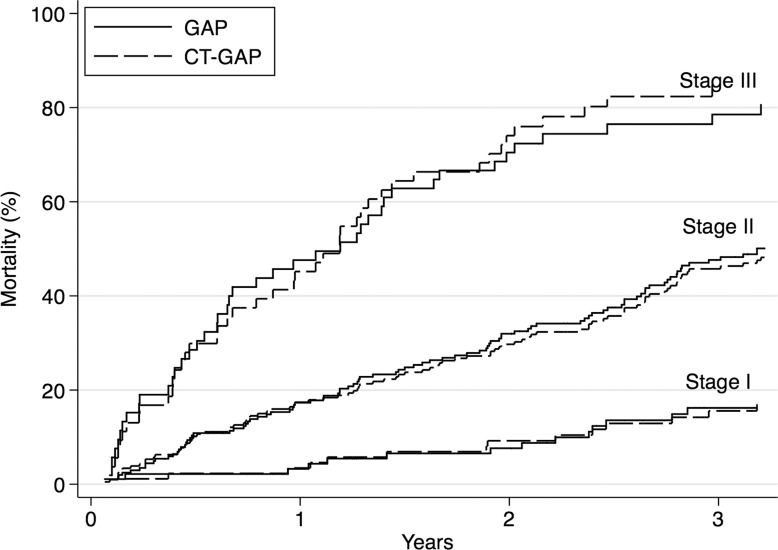
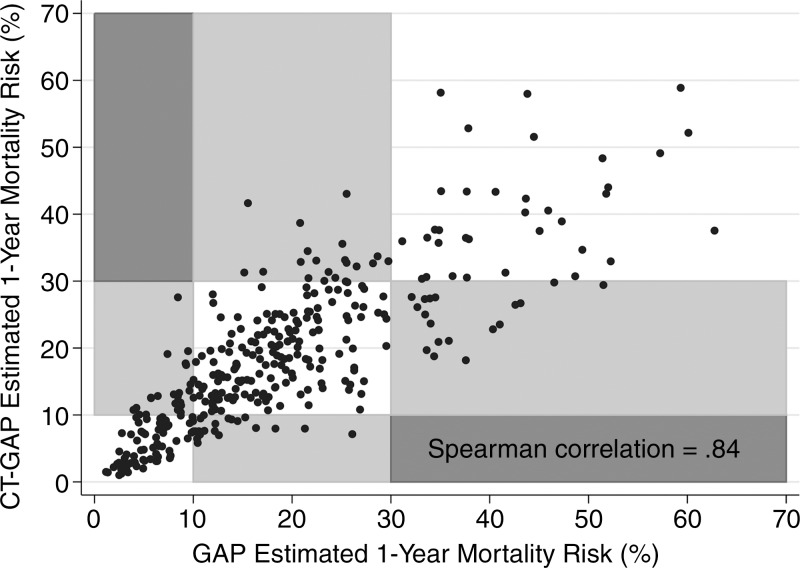
Results: The CT- GAP gender, age, and physiology model (a modification of the original GAP gender, age, and physiology model that replaces diffusion capacity of carbon monoxide with CT fibrosis score) had accuracy comparable to that of the original GAP gender, age, and physiology model, with a C index of 70.3 (95% confidence interval: 66.4, 74.0); difference in C index compared with the GAP gender, age, and physiology model of -0.4 (95% confidence interval: -2.2, 3.4). The performance of the original GAP gender, age, and physiology model did not change significantly with the simple addition of fibrosis score, with a change in C index of 0.0 (95% confidence interval: -1.8, 0.5) or of emphysema score, with a change in C index of 0.0 [95% confidence interval: -1.3, 0.4]).

Conclusion: CT fibrosis score can replace diffusion capacity of carbon monoxide test results in a modified GAP gender, age, and physiology model (the CT- GAP gender, age, and physiology model) with comparable performance. This may be a useful alternative model in situations where CT scoring is more reliable and available than diffusion capacity of carbon monoxide.


Figures

Figure 1:
Figure 1:
Graph shows cumulative incidence of death by stage for the CT-GAP and original GAP models.
Figure 2:
Figure 2:
Scatterplot shows correlation between CT-GAP–estimated and GAP-estimated risk of death. Grid boxes are shaded according to the shift in GAP stage between the two models. White boxes represent no shift in GAP stage between the two models, whereas light gray boxes represent a one-stage shift and dark gray boxes represent a two-stage shift. No patients were shifted two stages between the two models. GAP stage I = less than 10% risk of death in 1 year, GAP stage II = 10%–30% risk of death in 1 year, and GAP stage III = more than 30% risk of death in 1 year.
Figure 3:
Figure 3:
Illustration shows the categorical CT-GAP model in simple algorithm form. Lowest tier boxes show 1-year model-estimated risk of death in percentages, with 95% CIs in parentheses according to gender and age (eg, female 61–65). Pale green boxes correspond to low 1-year risk (<10%); yellow boxes correspond to intermediate 1-year risk (10%–30%); and red boxes correspond to high 1-year risk (>30%). Fibrosis = percentage of fibrosis at CT; FVC = forced vital capacity compared with percentage predicted.
Figure 4a:
Figure 4a:
CT images show application of categorical CT-GAP model in two patient examples. Patient 1 (a–c, upper, middle, and lower lung, respectively) is a 71-year-old woman with low fibrosis score of 4 and no emphysema. FVC was 81% of predicted, and DLCO was 61% of that predicted. Patient was alive after 3.4 years of follow-up. Estimated 1-year risk of death according to CT-GAP model was 7.3% (95% CI: 3.5%, 13.1%). Patient 2 (d–f, upper, middle, and lower lung, respectively) was a 75-year-old man with high fibrosis score of 42 and no emphysema. FVC was 46% of that predicted, and DLCO was 48% of that predicted. Patient died 163 days after evaluation. Estimated one-year risk of death according to CT-GAP model was 45.2% (95% CI: 32.8%, 56.6%).
Figure 4b:
Figure 4b:
CT images show application of categorical CT-GAP model in two patient examples. Patient 1 (a–c, upper, middle, and lower lung, respectively) is a 71-year-old woman with low fibrosis score of 4 and no emphysema. FVC was 81% of predicted, and DLCO was 61% of that predicted. Patient was alive after 3.4 years of follow-up. Estimated 1-year risk of death according to CT-GAP model was 7.3% (95% CI: 3.5%, 13.1%). Patient 2 (d–f, upper, middle, and lower lung, respectively) was a 75-year-old man with high fibrosis score of 42 and no emphysema. FVC was 46% of that predicted, and DLCO was 48% of that predicted. Patient died 163 days after evaluation. Estimated one-year risk of death according to CT-GAP model was 45.2% (95% CI: 32.8%, 56.6%).
Figure 4c:
Figure 4c:
CT images show application of categorical CT-GAP model in two patient examples. Patient 1 (a–c, upper, middle, and lower lung, respectively) is a 71-year-old woman with low fibrosis score of 4 and no emphysema. FVC was 81% of predicted, and DLCO was 61% of that predicted. Patient was alive after 3.4 years of follow-up. Estimated 1-year risk of death according to CT-GAP model was 7.3% (95% CI: 3.5%, 13.1%). Patient 2 (d–f, upper, middle, and lower lung, respectively) was a 75-year-old man with high fibrosis score of 42 and no emphysema. FVC was 46% of that predicted, and DLCO was 48% of that predicted. Patient died 163 days after evaluation. Estimated one-year risk of death according to CT-GAP model was 45.2% (95% CI: 32.8%, 56.6%).
Figure 4d:
Figure 4d:
CT images show application of categorical CT-GAP model in two patient examples. Patient 1 (a–c, upper, middle, and lower lung, respectively) is a 71-year-old woman with low fibrosis score of 4 and no emphysema. FVC was 81% of predicted, and DLCO was 61% of that predicted. Patient was alive after 3.4 years of follow-up. Estimated 1-year risk of death according to CT-GAP model was 7.3% (95% CI: 3.5%, 13.1%). Patient 2 (d–f, upper, middle, and lower lung, respectively) was a 75-year-old man with high fibrosis score of 42 and no emphysema. FVC was 46% of that predicted, and DLCO was 48% of that predicted. Patient died 163 days after evaluation. Estimated one-year risk of death according to CT-GAP model was 45.2% (95% CI: 32.8%, 56.6%).
Figure 4e:
Figure 4e:
CT images show application of categorical CT-GAP model in two patient examples. Patient 1 (a–c, upper, middle, and lower lung, respectively) is a 71-year-old woman with low fibrosis score of 4 and no emphysema. FVC was 81% of predicted, and DLCO was 61% of that predicted. Patient was alive after 3.4 years of follow-up. Estimated 1-year risk of death according to CT-GAP model was 7.3% (95% CI: 3.5%, 13.1%). Patient 2 (d–f, upper, middle, and lower lung, respectively) was a 75-year-old man with high fibrosis score of 42 and no emphysema. FVC was 46% of that predicted, and DLCO was 48% of that predicted. Patient died 163 days after evaluation. Estimated one-year risk of death according to CT-GAP model was 45.2% (95% CI: 32.8%, 56.6%).
Figure 4f:
Figure 4f:
CT images show application of categorical CT-GAP model in two patient examples. Patient 1 (a–c, upper, middle, and lower lung, respectively) is a 71-year-old woman with low fibrosis score of 4 and no emphysema. FVC was 81% of predicted, and DLCO was 61% of that predicted. Patient was alive after 3.4 years of follow-up. Estimated 1-year risk of death according to CT-GAP model was 7.3% (95% CI: 3.5%, 13.1%). Patient 2 (d–f, upper, middle, and lower lung, respectively) was a 75-year-old man with high fibrosis score of 42 and no emphysema. FVC was 46% of that predicted, and DLCO was 48% of that predicted. Patient died 163 days after evaluation. Estimated one-year risk of death according to CT-GAP model was 45.2% (95% CI: 32.8%, 56.6%).

References

    1. Raghu G, Collard HR, Egan JJ, et al. An official ATS/ERS/JRS/ALAT statement: idiopathic pulmonary fibrosis: evidence-based guidelines for diagnosis and management. Am J Respir Crit Care Med 2011;183(6):788–824. - PMC - PubMed
    1. Martinez FJ, Safrin S, Weycker D, et al. ; IPF Study Group . The clinical course of patients with idiopathic pulmonary fibrosis. Ann Intern Med 2005;142(12 Pt 1):963–967. - PubMed
    1. Fernández Pérez ER, Daniels CE, Schroeder DR, et al. Incidence, prevalence, and clinical course of idiopathic pulmonary fibrosis: a population-based study. Chest 2010;137(1):129–137. - PMC - PubMed
    1. King TE, Jr, Tooze JA, Schwarz MI, Brown KR, Cherniack RM. Predicting survival in idiopathic pulmonary fibrosis: scoring system and survival model. Am J Respir Crit Care Med 2001;164(7):1171–1181. - PubMed
    1. Wells AU, Desai SR, Rubens MB, et al. Idiopathic pulmonary fibrosis: a composite physiologic index derived from disease extent observed by computed tomography. Am J Respir Crit Care Med 2003;167(7):962–969. - PubMed

Publication types