Clinical Trial
. 2014 Jun 24;111(25):9301-6.
doi: 10.1073/pnas.1321072111. Epub 2014 Jun 9.

Resting GABA and glutamate concentrations do not predict visual gamma frequency or amplitude

Affiliations
Clinical Trial

Resting GABA and glutamate concentrations do not predict visual gamma frequency or amplitude

Helena Cousijn et al. Proc Natl Acad Sci U S A. .

Abstract

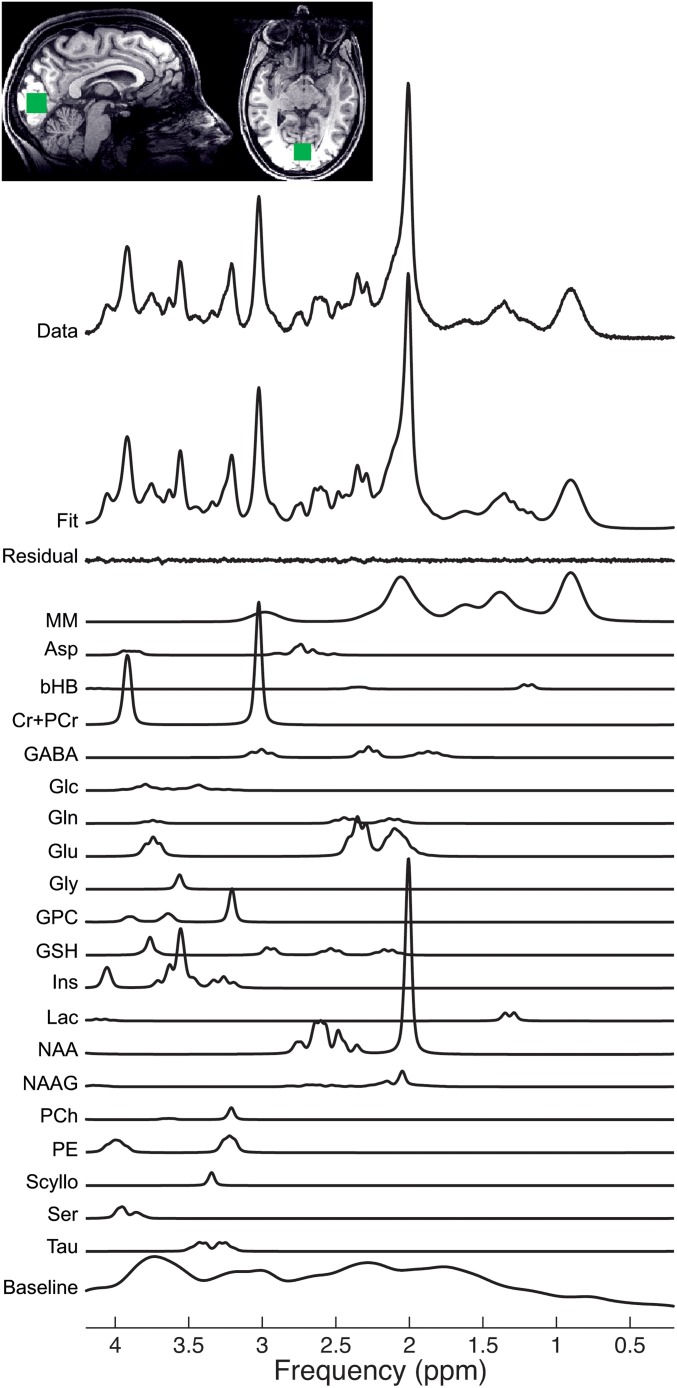
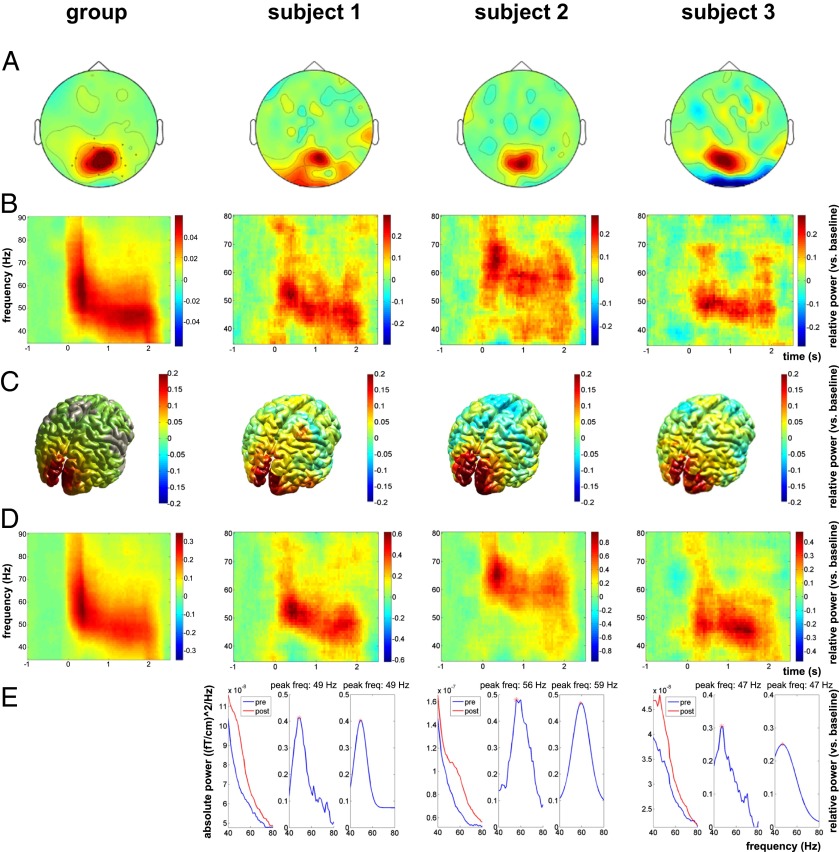
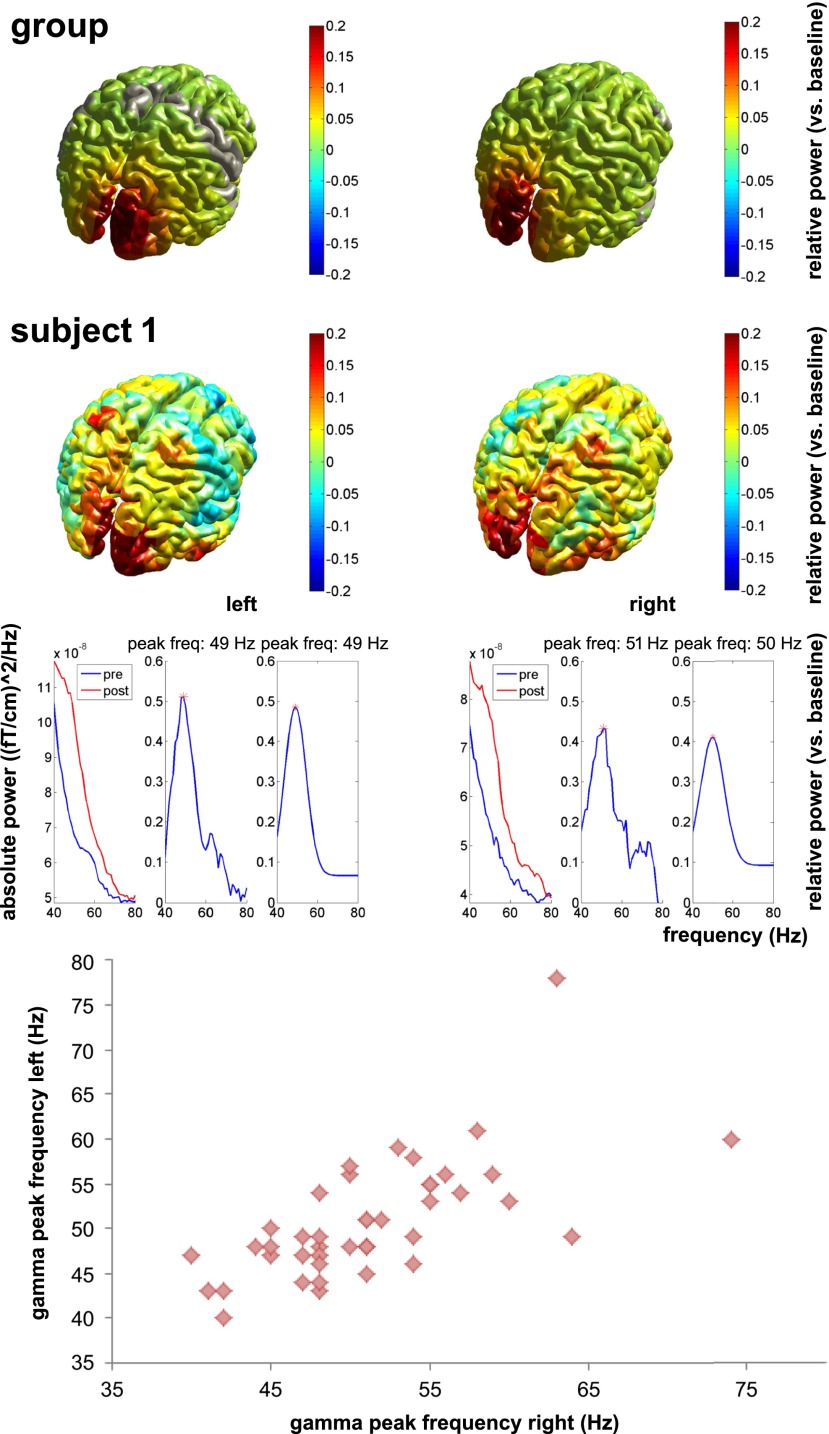
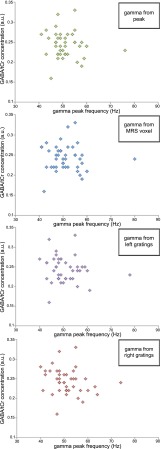
Gamma band oscillations arise in neuronal networks of interconnected GABAergic interneurons and excitatory pyramidal cells. A previous study found a correlation between visual gamma peak frequency, as measured with magnetoencephalography, and resting GABA levels, as measured with magnetic resonance spectroscopy (MRS), in 12 healthy volunteers. If true, this would allow studies in clinical populations testing modulation of this relationship, but this finding has not been replicated. We addressed this important question by measuring gamma oscillations and GABA, as well as glutamate, in 50 healthy volunteers. Visual gamma activity was evoked using an established gratings paradigm, and we applied a beamformer spatial filtering technique to extract source-reconstructed gamma peak frequency and amplitude from the occipital lobe. We determined gamma peak frequency and amplitude from the location with maximal activation and from the location of the MRS voxel to assess the relationship of GABA with gamma. Gamma peak frequency was estimated from the highest value of the raw spectra and by a Gaussian fit to the spectra. MRS data were acquired from occipital cortex. We did not replicate the previously found correlation between gamma peak frequency and GABA concentration. Calculation of a Bayes factor provided strong evidence in favor of the null hypothesis. We also did not find a correlation between gamma activity and glutamate or between gamma and the ratio of GABA/glutamate. Our results suggest that cortical gamma oscillations do not have a consistent, demonstrable relationship to excitatory/inhibitory network activity as proxied by MRS measurements of GABA and glutamate.


Conflict of interest statement

The authors declare no conflict of interest.

Figures

Fig. 1.
Fig. 1.
A typical spectrum from the occipital voxel (placement depicted), acquired using the SPECIAL sequence. The original MRS data are shown in the top row. The next row is the model fit produced from a linear combination model (15). The high quality of the fit is demonstrated by the small residual remaining after fitting, shown by the row labeled “residual.” Below, individual fits for all neurochemicals are demonstrated. Each neurochemical has multiple fitted peaks that reflect the individual protons within the molecule. Asp, aspartate; bHB, beta-hydroxybutyrate; Cr+PCr, total creatine; GABA, gamma-aminobutyric acid; Glc, glucose; Gln, glutamine; Glu, glutamate; Gly, glycine; GPC, glycerophosphocholine; GSH, glutathionine; Ins, myo-inositol; Lac, lactate; MM, macromolecules; NAA, n-acetylaspartate; NAAG, n-acetylaspartylglutamate; PCh, phosphocholine; PE, phosphorylethanolamine; Scyllo, scyllo-inositol; Ser, serine; Tau, taurine. GABA is found at a low concentration in the brain, as reflected by the relatively low-amplitude peaks. Despite this low concentration, the high quality of the fit for GABA is demonstrated by Cramer-Rao bands <20%.
Fig. 2.
Fig. 2.
Gamma band activation in response to presentation of the gratings at the group level and for three representative subjects. (A) Topoplots showing the location of activation in the gamma band at the sensor level. (B) Time-frequency representations show sustained activation in the gamma band for the duration of the stimulus presentation at posterior sensors. (C) Localization of gamma band activation in response to the gratings in source space. (D) Time-frequency representations show sustained activation at the location with peak activation in the gamma band. These patterns strongly resemble those in sensor space. (E) Graphs show the fitted peaks for each individual participant. The first part of the graph shows the spectrum before (blue) and during (red) the presentation of the grating (this is absolute power). The second graph shows the relative difference between these two spectra and the peak activation for the subject. The third graph shows the fitted Gaussian curve.
Fig. 3.
Fig. 3.
The upper part of the figure shows that activations in the gamma band in response to the gratings are lateralized, with the presentation of gratings on the left side of the screen leading to activation in the right occipital lobe and presentation of gratings on the right side of the screen leading to activation in the left occipital lobe. The row below shows a similar lateralized activation pattern in a representative subject (subject 1). Underneath, the peak frequencies in the left and right occipital lobe are shown for this same subject. The lower part of the figure shows the strong correlation between gamma peak frequency estimates for the left and right gratings separately.
Fig. 4.
Fig. 4.
No correlations were observed between GABA concentration and gamma peak frequency based on the peak activation (Upper), between GABA concentration and gamma peak frequency from the location of the MRS voxel (Second image), between GABA concentration and gamma peak frequency based on left gratings only (Third image), or between GABA concentration and gamma peak frequency based on right gratings only (Bottom). tCr = total creatine; n = 42.

References

    1. Fries P. Neuronal gamma-band synchronization as a fundamental process in cortical computation. Annu Rev Neurosci. 2009;32:209–224. - PubMed
    1. Buzsáki G, Wang XJ. Mechanisms of gamma oscillations. Annu Rev Neurosci. 2012;35:203–225. - PMC - PubMed
    1. Wang XJ. Neurophysiological and computational principles of cortical rhythms in cognition. Physiol Rev. 2010;90(3):1195–1268. - PMC - PubMed
    1. Bartos M, Vida I, Jonas P. Synaptic mechanisms of synchronized gamma oscillations in inhibitory interneuron networks. Nat Rev Neurosci. 2007;8(1):45–56. - PubMed
    1. Traub RD, Whittington MA, Stanford IM, Jefferys JG. A mechanism for generation of long-range synchronous fast oscillations in the cortex. Nature. 1996;383(6601):621–624. - PubMed

Publication types