Clinical Trial
. 2014 Jun 24;111(25):E2606-15.
doi: 10.1073/pnas.1322184111. Epub 2014 Jun 9.

Immersive audiomotor game play enhances neural and perceptual salience of weak signals in noise

Affiliations
Clinical Trial

Immersive audiomotor game play enhances neural and perceptual salience of weak signals in noise

Jonathon P Whitton et al. Proc Natl Acad Sci U S A. .

Abstract

All sensory systems face the fundamental challenge of encoding weak signals in noisy backgrounds. Although discrimination abilities can improve with practice, these benefits rarely generalize to untrained stimulus dimensions. Inspired by recent findings that action video game training can impart a broader spectrum of benefits than traditional perceptual learning paradigms, we trained adult humans and mice in an immersive audio game that challenged them to forage for hidden auditory targets in a 2D soundscape. Both species learned to modulate their angular search vectors and target approach velocities based on real-time changes in the level of a weak tone embedded in broadband noise. In humans, mastery of this tone in noise task generalized to an improved ability to comprehend spoken sentences in speech babble noise. Neural plasticity in the auditory cortex of trained mice supported improved decoding of low-intensity sounds at the training frequency and an enhanced resistance to interference from background masking noise. These findings highlight the potential to improve the neural and perceptual salience of degraded sensory stimuli through immersive computerized games.

Keywords: cortical; foraging; gradient search; hearing; noise suppression.


Conflict of interest statement

The authors declare no conflict of interest.

Figures
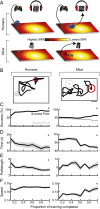
Fig. 1.
Fig. 1.
Humans and mice learn to use dynamic auditory cues to locate hidden targets. (A, Upper) Humans played an audio game wherein the movements of an avatar were controlled with a game pad, while (Lower) mice trained in a physical behavioral arena. The heat map corresponds to SNR. (B) A representative trial for a human and a mouse illustrates casting and zigzagging behaviors along the sound gradient. The filled and open circles indicate the center and perimeter of the target (red) and “dummy” (gray) zones. The green dots indicate position at the start of the trial. (Scale bar: 10 and ∼3.5 cm for the mouse and human arena, respectively.) Time spent in “dummy” targets provides the basis for calculating target identification by chance alone. (C) Percentage of trials in which humans (Left) and mice (Right) located the target within the time constraints across the training period. (D) Time and (E) length of path required to complete trial as a function of training time. Path length taken to reach the target was normalized by the diagonal distance of the training arena. (F) Likewise, running speed is reported as normalized distance per second and plotted as a function of training time. The line plots reflect mean ± SEM. Significant learning effects are indicated with an asterisk in the upper right-hand corner of the plot.
Fig. 2.
Fig. 2.
Adaptive sensory-guided foraging strategies emerge with practice. (A–C, Far Left) Individual early and late training trials for two humans and a mouse. (Right) Movement speed and trajectory from sequential epochs of the corresponding “late” exemplar trial (time progresses from left to right). The concentric circles demarcate the mapping of auditory SNR onto the 2D training arena. Direction of arrowheads reflect trajectory, color of arrows represents search speed normalized at the trial level, and arrow size reflects search speed normalized across all three examples. The gray arrows are superimposed from the previous time epoch(s). (Scale bar: 10 and ∼3.5 cm for the mouse and human arena, respectively.) The filled and open circles indicate the center and perimeter of the target (red) and “dummy” (gray) zones. The green dots indicate position at the start of the trial. (D) The difference between actual trajectory and the ideal bearing is calculated every 0.3 s. Adaptive search strategies could emphasize movements toward the target (target bias, magenta) or along the steepest slope of the SNR gradient (SNR bias, cyan). (E) Like angular target and SNR bias, normalized search speed can also be expressed across movement trajectories. (FH) Normalized distributions of (Upper) search trajectories and (Lower) speed modulation early vs. late in training for the two example human subjects (F and G) and one mouse (H). [Speed axis bar: 0.13–0.19 d/s in humans and 0.09–0.21 d/s in the mouse; mean speed (white foreground); SEM (gray background).] (I–K) Target and SNR bias in movement trajectories (Upper) or speed (Lower) for human subjects who used foraging strategy A (I; n = 4) or B (J; n = 6), and all trained mice (K; n = 4) plotted as a function of training time. Foraging strategy A is defined by an exclusive increase in toward target bias with training (four subjects, including Human 1, used this strategy), while foraging strategy B is defined by increased SNR and toward target bias (six subjects, including Human 2, used this strategy). The line plots reflect mean ± SEM.
Fig. 3.
Fig. 3.
Foraging strategy is modulated by local sensory context. This visualization breaks down the overall foraging biases plotted in Fig. 2 according to spatial position within the SNR training arena. For all plots, behavioral data are shown from well-trained subjects (second half of training) according to spatial proximity to the target, expressed as SNR. The broken vertical red lines indicate target SNRs. The solid and broken lines reflect data from successful (i.e., rewarded) and failed trials, respectively. The broken horizontal black bars indicate unbiased foraging behavior. (A and C) Target bias in angular search trajectory (Upper) and speed (Lower) for all humans (A) and mice (C). (B and D) SNR bias in angular search trajectory (Upper) and speed (Lower) for humans (B) and mice (D). SNR bias is plotted separately for subjects using strategy B vs. those that did not (strategy A, Inset). (E and F) Overall search speed is plotted as a function of distance from target in humans (E) and mice (F). The unit of measurement for speed (d/s) is distance traveled, normalized to the diagonal length of the training arena, per second. Data are plotted as mean ± SEM.
Fig. 4.
Fig. 4.
Learned improvements in auditory-guided foraging generalize to distinct listening tasks. (A) The physical stimulus waveform used in the foraging task (Top) is similar to the stimulus used for the tone in noise task (Middle) but dissimilar to the test of speech perception in multitalker babble (Bottom). (B) Change in tone detection thresholds (Post – Pre) assessed at four tone frequencies (training frequency indicated by arrow). (C) Change in words correctly recognized for the speech in noise task (Post – Pre) plotted according to target speaker SNR. (D and E) Correlation between change in search speed (D) and SNR bias (E) at locations between 0 and 5 dB SNR and improved performance on the speech in noise test at 0 dB SNR. The horizontal lines in scatter plots reflect group means. The asterisks indicate statistically significant differences between groups.
Fig. 5.
Fig. 5.
Low SNR foraging is associated with a reorganized cortical representation of the target stimulus. (A) FRAs (outlined in white) were delineated at each recording site by measuring multiunit spikes (sp) to tone pips presented at 527 frequency by level combinations. (B) Distribution of characteristic frequencies (CFs) measured from trained (black) and passively exposed control (gray) mice. The arrow indicates training frequency. (C) Representative multiunit rate-level functions from a trained and passively exposed mouse. Monotonicity (mono) is calculated from the slope of the linear fit line applied to the high-intensity region of the rate-level function (dashed lines). (D) Histogram of monotonicity values recorded in trained and passively exposed mice. The brackets delineate monotonic vs. low-intensity tuned, nonmonotonic slope values. (E) Histogram of preferred sound level measured in trained and passively exposed recording sites. The red lines demarcate levels used in the foraging task. (F) Best frequency plotted separately for each intensity cross-section within the FRA (adjusted to the CF and threshold for each recording site). (G and H) The normalized FRA averaged across all recording sites for passively exposed (G) and trained (H) mice. The frequency and level range of the target tone from the foraging task is designated by the black rectangles. The white line depicts the linear regression fit to the best frequency at each sound level. Error bars represent SEM.
Fig. 6.
Fig. 6.
Auditory foraging enhances cortical encoding of weak tones embedded in noise. (A) Example FRAs recorded from a single A1 site in a passively exposed (Left) and trained (Right) mouse in the presence of varying levels of continuous masking noise. The white outline designates receptive field boundaries without masking noise. The black rectangle and bracket indicate the frequency/intensity of target and the masking noise level in the training task, respectively. (B) Neural SNR in quiet, low (40–50 dB), and high levels (60–70 dB) of masking noise. (C) Firing rate measured during the response to the target tone (signal) vs. a prestimulus period (noise). (D) Example 16-kHz rate-level functions. (E) Mean absolute change in normalized firing rate between neighboring sound levels (Upper) and mean Fisher information (Lower) for the target frequency at various signal to noise ratios (50-dB masking noise). For D and E, the vertical red lines and cyan rectangles indicate the target intensity and masking noise level, respectively. (F) In silico classification of tone level from individual trials in passive and trained neural recordings. The broken black line indicates chance classification. All data reflect mean ± SEM. Significant pairwise differences and group effects (C) are indicated with asterisks.

Similar articles

Cited by

References

    1. Stephens D, Krebs J. 1987. Foraging Theory (Princeton Univ Press, Princeton)
    1. Charnov EL. Optimal foraging, the marginal value theorem. Theor Popul Biol. 1976;9(2):129–136. - PubMed
    1. Greggers U, Menzel R. Memory dynamics and foraging strategies of honeybees. Behav Ecol Sociobiol. 1993;32(1):17–29.
    1. Kennedy JS. Zigzagging and casting as a programmed response to wind-borne odor—a review. Physiol Entomol. 1983;8(2):109–120.
    1. Porter J, et al. Mechanisms of scent-tracking in humans. Nat Neurosci. 2007;10(1):27–29. - PubMed

Publication types