. 2015 Oct;25(10):3290-302.
doi: 10.1093/cercor/bhu125. Epub 2014 Jun 13.

Cortical and Clonal Contribution of Tbr2 Expressing Progenitors in the Developing Mouse Brain

Affiliations

Cortical and Clonal Contribution of Tbr2 Expressing Progenitors in the Developing Mouse Brain

Navneet A Vasistha et al. Cereb Cortex. 2015 Oct.

Abstract

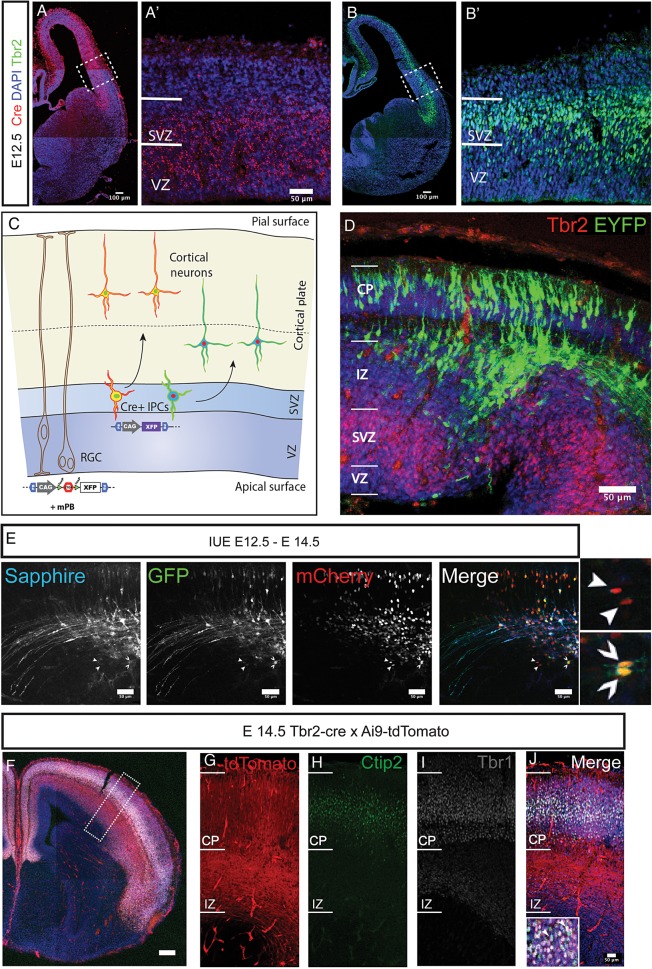
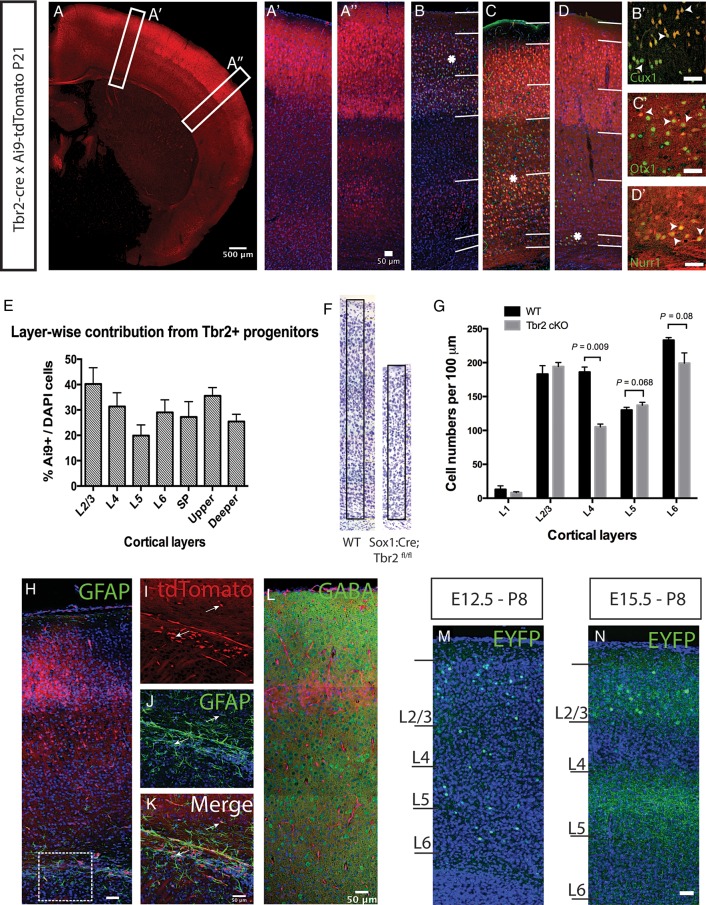
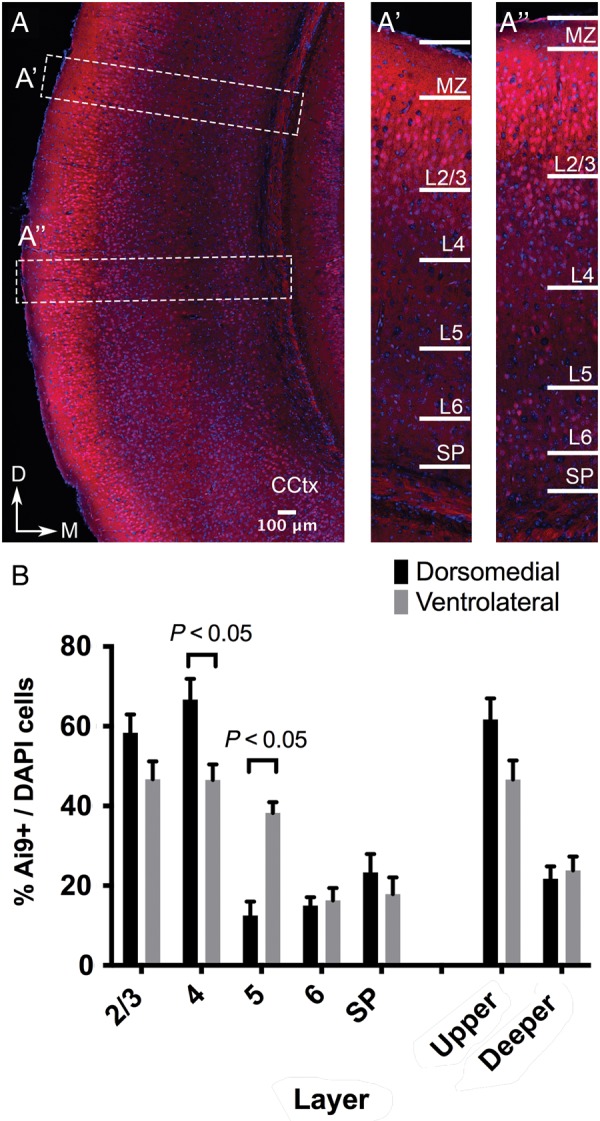
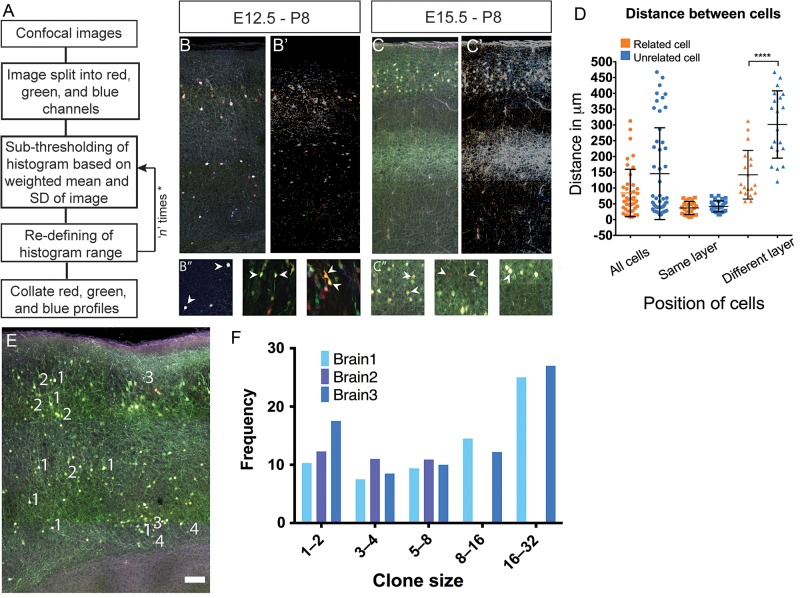
The individual contribution of different progenitor subtypes towards the mature rodent cerebral cortex is not fully understood. Intermediate progenitor cells (IPCs) are key to understanding the regulation of neuronal number during cortical development and evolution, yet their exact contribution is much debated. Intermediate progenitors in the cortical subventricular zone are defined by expression of T-box brain-2 (Tbr2). In this study we demonstrate by using the Tbr2(Cre) mouse line and state-of-the-art cell lineage labeling techniques, that IPC derived cells contribute substantial proportions 67.5% of glutamatergic but not GABAergic or astrocytic cells to all cortical layers including the earliest generated subplate zone. We also describe the laminar dispersion of clonally derived cells from IPCs using a recently described clonal analysis tool (CLoNe) and show that pair-generated cells in different layers cluster closer (142.1 ± 76.8 μm) than unrelated cells (294.9 ± 105.4 μm). The clonal dispersion from individual Tbr2 positive intermediate progenitors contributes to increasing the cortical surface. Our study also describes extracortical contributions from Tbr2+ progenitors to the lateral olfactory tract and ventromedial hypothalamic nucleus.

Keywords: CLoNe; Cerebral cortex; clonal analysis; fate-mapping; intermediate progenitors; subventricular zone.


Figures

Figure 1.
Figure 1.
Analysis of IPC derived neurons in the Tbr2Cre mouse with stable transfection of fluoroproteins and Ai9-tdTomato reporter mouse. (A,A′) Expression of the cre-recombinase in Tbr2Cre at E12.5 revealed with FISH. Cre mRNA is selectively expressed in the dorsal pallium and not in the subpallium in accordance with the known expression of Tbr2. Boxed region in A is shown with higher magnification in A′. (B,B′) Tbr2 immunoreactivity on an adjacent section to the one shown in A confirms the correlation between Tbr2 and Cre expression. Boxed region is shown with higher magnification in B′. (C) Schematic representation of the lineage analysis with stable transfection of CAG-STOP-floxed fluoroproteins using a constitutively expressing transposase plasmid by in utero electroporation. The constructs are taken up by the radial progenitors and passed on to IPCs where the recombination occurs leading to expression of fluorophores. (D) Single fluorophore (STOP-EYFP) transfection at E12.5 (collected at E14.5) revealed labeled cells in IZ, SP, and cortical plate, but not in VZ and SVZ, suggesting that the excision of the stop-floxed cassette occurs within the SVZ at the level of the Tbr2 positive IPCs (immunoreactivity for Tbr2 in red). (E) The method outlined in C can be extended to various CAG-STOP-floxed fluoroproteins to identify clonally derived cells. The shown example utilized 3 fluorophores (Sapphire, GFP, mCherry). Arrowheads indicate pairs of cells expressing the same combination of fluoroproteins. (FJ) Immunostaining sections from brains derived from breeding Tbr2Cre and Ai9-tdTomato mouse lines at E14.5 revealed that Ctip2 (H) and Tbr1 (I) immunoreactive neurons are derived through Tbr2 positive IPCs. Scale bars: A,B,F: 100 μm, rest are 50 μm.
Figure 2.
Figure 2.
Tbr2-positive IPCs derived neurons contribute to all layers of the cortex. (A) Coronal section through a P21 brain derived from breeding Tbr2Cre and Ai9-tdTomato mouse. A′ and A″ were taken with higher power from regions indicated in A. (BD) The cortical segment indicated in A″ was stained and imaged for Cux1 (B), Otx1 (C) and Nurr1 (D) immunoreactivity. Asterisks indicate the region in Layers 2–3 (B′), Layers 5–6 (C′) and SP (D′) where the high power images were taken. Arrowheads in B′–D′ indicate examples of double positive neurons. (E) The percentage of Ai9-tdTomato expressing cells from all DAPI stained cells in P21 sections (shown in A″) shows that 20–40% of all layers is derived through Tbr2+ IPCs in S1. Layers 2–3 shows the highest (40.2%) while Layer 5 is the least (19.8%). A total of 4 brains from 2 litters was used and at least 3 sections from each brain counted from. A minimum of 500 cells was counted in each section. (F) Images of Nissl stained somatosensory cortex from coronal sections of wild-type (WT) and Tbr2 conditional KO (Sox1Cre, Tbr2fl/fl) indicate reduced thickness. Arbitrary unit columns of 100 μm were boxed on the WT and Tbr2 cKO cortex. (G) Comparison of neuronal numbers in individual layers within a 100 μm column of wild type (WT) and Tbr2 conditional KO S1 cortex revealed significant reduction of Layers 4 and 6 and marginal increase in Layer 5. Three brains each from WT and cKO animals were used for cell counting where at least 3 sections from each brain at the S1 cortical level were counted. (H) GFAP immunohistochemistry on Ai9 brain sections at P7. Reactivity can be seen mostly in the white matter (boxed), but much less in other layers of the cortex. (IK) Higher power images from the boxed region in H shows clusters of Ai9+ cells (I; arrows) in close proximity with GFAP+ cells (J,K; arrows) in the white matter of P7 brains. (L) Immunohistochemistry for GABA did not reveal any colocalisation with Ai9+ cells indicating that these were not GABA-ergic neurons. Three sections each from 3 brains were stained to check for colocalisation. (M,N) Single fluorophore (STOP-EYFP) labeling of clones born at E12.5 (M) and E15.5 (N). Early fate mapping at E12.5 (M) shows Tbr2+ IPCs give rise to cells across Layers 2–6 while at a later stage at E15.5 (N) cells can only be seen in the supragranular layers. Scale bars: a: 500 μm, rest are 50 μm.
Figure 3.
Figure 3.
Areal variations in numbers of Tbr2 IP derived neurons with reciprocal differences between Layer 4 and 5 dorsomedial and ventrolateral cortices of the presumptive visual cortex. A The Tbr2 IPC derived Ai9+ cells are distributed across all cortical layers throughout the cortex. We compared their variation in number in selected areas labeled with boxes A′ and A″ in A (CCtx: Caudal Cortex). A′ and A″ We counted the number of Ai9+ cells in each layer between the dorsomedial (A′) and ventrolateral regions (A″). B Similar proportion of Ai9+ cells could be seen in Layers 2/3 (58.33 ± 4.6 vs. 46.67 ± 4.5, n = 2 brains, P = 0.12 multiple t-test with correction) but there was an appreciable difference in Layer 4 (66.67 ± 5.2 vs. 46.51 ± 3.9, n = 2, P = 0.048) and in Layer 5 (12.50 ± 3.5 vs. 38.24 ± 2.7, n = 2 brains, P = 0.014). No difference was noticed when all layers were grouped together suggesting against differences in cell densities (35.1 vs. 35.62). Scale bar 100 μm.
Figure 4.
Figure 4.
Analysis of the laminar and areal distribution of neurons derived from individual Tbr2+ intermediate progenitors in the Tbr2Cre mouse with stable transfection of fluoroproteins. (A) Algorithm for histogram based image clustering and segmentation. This algorithm was used to identify fluorescent cells that showed similar RGB properties and could be said to be clonal in origin. (B,C) Example of E12.5 (B) and E15.5 (C) electroporated brain labelled using CLoNe used for thresholding and the resulting thresholded image (B′,C′). Fluorescent cells of various hues can be seen in different layers. (B″,C″) Examples of clonally related cells identified using the algorithm. (D) Graph representing distance measured between clonally related and unrelated cells in same layer (36.8 ± 20.54 μm vs. 41.8 ± 17.30 μm), different layers (142.1 ± 76.8 μm vs. 294.9 ± 105.4 μm) and total (84.4 μm vs. 145.64 μm). Only cells clustered in different layers show significant difference as compared with unrelated cells (P < 0.0001, Mann–Whitney test). (E) Example of a 150 μm SeeDB clarified tissue section imaged under 4 channels and used for analysis. Numbers (in white) indicate clonal groups (1–4). Distribution of clonal group (1) is the most widespread radially, whereas 2 and 3 align in more radial fashion. Scale bar: 100 μm. (F) Graphical representation of clonal sizes and their frequency of occurrence. Clonal groups of 8–16 were found more frequently than those between 1 and 8. Also frequencies of larger clonal groups of 16–32 was the highest in the data analyzed from 3 brains electroporated at E12.5 and collected at P8. 3 serial sections each of 100–150 μm were studied and atleast 200 cells were studied in each section.
Figure 5.
Figure 5.
Characterisation of Tbr2+ IPC derived SP neurons for ChAT expression and various markers at P7 and P21. (AD) Tbr2 derived SP cells (tdTomato) were stained from ChAT at P21 (A,B) and at P7 (C,D). No ChAT+ tdTomato+ cells in the SP or white matter at P21 or P7 were found (n = 3 brains) despite ChAT+ cells being present in the globus pallidus (arrows in B). Similar to P21, no ChAT+ cells were seen at this age in SP/WM region either despite their presence in the ventrobasal areas of the forebrain (D). (EG) Tbr2 derived SP cells were positive for Cplx3 and Nurr1 (arrows in F,G) but not for the interneuron marker parvalbumin (E). SP, subplate; Str, striatum, WM, white matter; Ctx, cortex; GP, globus pallidus. Scale bars 50 μm.
Figure 6.
Figure 6.
Extracortical contributions of Tbr2+ IPCs. (A) Tbr2 immunoreactivity is detected at E14.5 in the septum (Spt, arrowhead) and in the lateral olfactory tract (lot). Inset shows expression in the lot from boxed area. LV, lateral ventricle. (B) Ai9+ (red) cells in the septal regions colocalise with Tbr1 (green) in the Tbr2Cre bred with Ai9-tdTomato. Tbr1 expression (B″, arrowhead) overlaps with Ai9 (B′, arrowhead) indicating glutamatergic nature of these cells. B′ and B″ are taken from the boxed region of an adjacent section. (C) Tbr2 is also expressed in the prethalamus (PTh) as indicated by Ai9+ cells at E14.5. Cells can be seen on either sides of the DTB. Inset shows expression of Tbr2 in the thalamic eminence. (D) On a more posterior section Ai9+ cells can be seen crossing the DTB and also in the lot at that level. Inset shows that some cells in the prethalamus coexpress calbindin (arrowheads). Abbreviations: 3V: 3rd Ventricle, HT: Hypothalamus, ic: internal capsule, Ag: amygdala, lot: lateral olfactory tract. (E) Coronal section from a brain derived from the breeding of Ai9-tdTomato and Tbr2Cre at P7 shows expression is maintained in the lot. Inset shows labeled cells in higher magnification in lot. PCx: piriform cortex. E′ and E″ show that cells in the hypothalamus and prethalamus also continue to express Ai9 at postnatal ages (taken from E at the sites of e′ and e″). (F) Cell of the indusium grisuem (IG; G,G′) and bed nucleus of anterior commissure (BAC; H,H′) express Ai9 in a P7 Tbr2Cre × Ai9 section. (G,H) show expression in a corresponding section. (G) Expression of Ai9 can be seen in the cells of the IG next to the midline and above the fibers of corpus callosum (also labeled by Ai9). Inset shows higher magnification. (H) Ai9 expression can be seen in BAC as well as in the anterior commissure. Inset shows higher magnification from the boxed region. Scale bars: a: 100 μm, EF: 200 μm while rest is 50 μm.

References

    1. Arnold SJ, Huang G-J, Cheung AF, Era T, Nishikawa S-I, Bikoff EK, Molnar Z, Robertson EJ, Groszer M. 2008. The T-box transcription factor Eomes/Tbr2 regulates neurogenesis in the cortical subventricular zone. Genes Dev. 22:2479–2484. - PMC - PubMed
    1. Arnold SJ, Sugnaseelan J, Groszer M, Srinivas S, Robertson EJ. 2009. Generation and analysis of a mouse line harboring GFP in the Eomes/Tbr2 locus. Genesis. 47:775–781. - PMC - PubMed
    1. Arora S, Acharya J, Verma A, Panigrahi PK. 2008. Multilevel thresholding for image segmentation through a fast statistical recursive algorithm. Pattern Recognit Lett. 29:119–125.
    1. Baala L, Briault S, Etchevers HC, Laumonnier F, Natiq A, Amiel J, Boddaert N, Picard C, Sbiti A, Asermouh A, et al. 2007. Homozygous silencing of T-box transcription factor EOMES leads to microcephaly with polymicrogyria and corpus callosum agenesis. Nat Genet. 39:454–456. - PubMed
    1. Betizeau M, Cortay V, Patti D, Pfister S, Gautier E, Bellemin-Ménard A, Afanassieff M, Huissoud C, Douglas RJ, Kennedy H, et al. 2013. Precursor diversity and complexity of lineage relationships in the outer subventricular zone of the primate. Neuron. 80:442–457. - PubMed

Publication types

MeSH terms