. 2014 Jun:458-459:190-208.
doi: 10.1016/j.virol.2014.03.021. Epub 2014 May 24.

Production and characterization of high-titer serum-free cell culture grown hepatitis C virus particles of genotype 1-6

Affiliations

Production and characterization of high-titer serum-free cell culture grown hepatitis C virus particles of genotype 1-6

Christian K Mathiesen et al. Virology. 2014 Jun.

Abstract

Recently, cell culture systems producing hepatitis C virus particles (HCVcc) were developed. Establishment of serum-free culture conditions is expected to facilitate development of a whole-virus inactivated HCV vaccine. We describe generation of genotype 1-6 serum-free HCVcc (sf-HCVcc) from Huh7.5 hepatoma cells cultured in adenovirus expression medium. Compared to HCVcc, sf-HCVcc showed 0.6-2.1 log10 higher infectivity titers (4.7-6.2 log10 Focus Forming Units/mL), possibly due to increased release and specific infectivity of sf-HCVcc. In contrast to HCVcc, sf-HCVcc had a homogeneous single-peak density profile. Entry of sf-HCVcc depended on HCV co-receptors CD81, LDLr, and SR-BI, and clathrin-mediated endocytosis. HCVcc and sf-HCVcc were neutralized similarly by chronic-phase patient sera and by human monoclonal antibodies targeting conformational epitopes. Thus, we developed serum-free culture systems producing high-titer single-density sf-HCVcc, showing similar biological properties as HCVcc. This methodology has the potential to advance HCV vaccine development and to facilitate biophysical studies of HCV.

Keywords: Adenovirus expression medium; Biophysical characterization; Cell culture system; Genotypes; Hepatitis C virus; High-titer; Neutralization; Receptor blocking; Serum-free; Vaccine development.


Figures

Figure 1
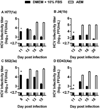
Figure 1. Serum-free Huh7.5 cell cultures produced high-titer sf-HCVcc
Huh7.5 cells were infected with (A) H77(1a), (B) J4(1b), (C) S52(3a) and (D) ED43(4a) JFH1-based Core-NS2 recombinants in DMEM + 10% FBS for 18 hours. Cells were split into two replicate DMEM + 10% FBS cultures. When ~80% of culture cells were infected, as determined by HCV NS5A immunostaining, one replicate culture was maintained in DMEM + 10% FBS (black bars), while the other replicate culture was maintained in AEM (grey bars). At the indicated day post infection, supernatants were collected and DMEM + 10% FBS cultures were split, while fresh medium was added to AEM cultures as described in Materials and Methods. Supernatant HCVcc infectivity titers are shown as means of 3 replicates with standard error of the mean (SEM). The lower limit of detection in the experiments shown was up to 2.7 log10 FFU/ml, indicated by y-axis break. *, at this time point, the experiment consisted only of replicate cultures maintained in DMEM + 10% FBS; only one culture was titrated.
Figure 2
Figure 2. Generation of genotype 1–6 sf-HCVcc virus stocks
Huh7.5 cells were infected with the indicated viruses in DMEM + 10% FBS at an MOI of 0.003 for 6 hours. On day 6 to 15 post infection, depending on the growth kinetics of the respective virus, when 40–80% of culture cells were infected, as determined by HCV NS5A immunostaining, DMEM + 10% FBS was replaced by AEM. At the indicated day post infection, supernatant was collected and fresh AEM was added to the cells. Supernatant HCVcc infectivity titers are shown as means of 3 replicates with standard error of the mean (SEM). Black bars represent DMEM + 10% FBS supernatant HCVcc infectivity titers; grey bars represent AEM supernatant sf-HCVcc infectivity titers. The lower limit of detection in the experiments shown was up to 2.3 log10 FFU/ml, indicated by y-axis break.
Figure 3
Figure 3. Increased infectivity titers of serum-free cell cultures were not due to reduced cell-splitting, changes in cell viability or proliferation, or increased viral stability
(A) AEM cultures produced higher infectivity titers than DMEM + 10% FBS cultures handled similarly and DMEM + 10% FBS control cultures. Huh7.5 cells were infected with the SA13(5a) JFH1-based Core-NS2 recombinant in DMEM + 10% FBS for 3 hours at an MOI of 0.003. On day 4 post-infection, cells were split into three replicate cultures. Following day 6 post infection, when ~80% of culture cells were infected, as determined by HCV NS5A immunostaining, one replicate culture was maintained in DMEM + 10% FBS and split every 2–3 days, another replicate culture was maintained in DMEM + 10% FBS without being split, while the third replicate culture was maintained in AEM without being split. At the indicated days post infection, supernatants were collected. Supernatant HCVcc infectivity titers are shown as means of 3 replicates with standard error of the mean (SEM). The lower limit of detection in the experiment shown was up to 2.6 log10 FFU/ml, indicated by y-axis break. * The culture originally infected with SA13(5a) was first split into three replicates at day 4 post infection; thus, on day 1 and 4 post infection only one infectivity titer is shown. On day 6, DMEM + 10% FBS supernatants were harvested from the three replicate cultures; subsequently cultures were maintained in the different growth media indicated. (B) AEM cultures showed similar viability and proliferation as DMEM + 10% FBS cultures. Cell viability or proliferation of Huh7.5 cells cultured for 48 hours in AEM versus DMEM + 10% FBS was determined as described in Materials and Methods. The % viability/proliferation was calculated by relating absorbance at 490 nm (viability) or 450 nm (proliferation) determined for AEM cultures to the mean absorbance of 10 replicate DMEM + 10% FBS cultures. Bars represent the means of 10 replicates with SEM. (C) sf-HCVcc and HCVcc showed similar freeze-thaw stability. SA13(5a) diluted 1:100 in DMEM + 10% FBS or sf-SA13(5a) diluted 1:100 in either AEM or AEM + 10% FBS were exposed to up to 5 freeze/thaw cycles. Samples were thawn at room temperature and frozen at −80°C. After the indicated number of cycles, infectivity titers were determined as described in Materials and Methods. The % infectivity was calculated by relating the infectivity titer of each sample to the mean titer of a reference sample of the same stock, which had been stored at −80°C. Bars represent the means of three replicates with SEM. (D) sf-HCVcc showed decreased stability under temperature stress. SA13(5a) diluted 1:100 in DMEM + 10% FBS or sf-SA13(5a) diluted 1:100 in either AEM or AEM + 10% FBS were incubated at 4°C, room temperature (RT) or 37°C for 4 to 48 hours as indicated. Infectivity titers were determined as described in Materials and Methods. The % infectivity was calculated by relating the infectivity titer of each sample to the mean titer of a reference sample of the same stock, which had been stored at −80°C. Bars represent the means of three replicates with SEM. The lower limit of detection in the experiment shown was up to 2%, indicated by y-axis break.
Figure 4
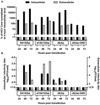
Figure 4. Serum-free culture decreased viral replication/translation but enhanced viral release and specific infectivity
S29 cells were transfected with SA13(5a) as well as positive control (J6(2a)) and negative control (J6(2a)-GND) HCV RNA transcripts as described in Materials and Methods. (A) Intracellular (black bars) and extracellular (grey bars) Core levels were determined 24, 48 and 72 hours post transfection. Core levels were normalized to intracellular Core levels measured 4 hours post transfection. (B) Intracellular (black bars) and extracellular (grey bars) infectivity titers were determined 24, 48 and 72 hours post transfection. Infectivity titers are shown as the means (FFU/well) of three replicates with SEM. The lower limits of detection are indicated by y-axis breaks.
Figure 5
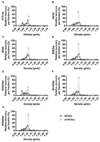
Figure 5. The sf-HCVcc particles of genotype 1–6 displayed an altered density profile with a single infectivity peak
Of the virus stocks described in Figure 2, 10mL HCVcc supernatant taken from the last harvest of DMEM + 10% FBS culture supernatant (black line) or 10mL sf-HCVcc supernatant taken after 48 hours of AEM culture (grey, dotted line) was concentrated and layered on top of a pre-formed 10–40% iodixanol gradient and subjected to ultracentrifugation as described in Materials and Methods. Fractions were collected from the bottom of the gradients and analyzed by infectivity titration and by density determination as described in Materials and Methods. The HCV Core-E2 sequences of all virus stocks used were determined by direct sequencing. Compared to the plasmid sequence, sf-H77(1a) and H77(1a) had acquired the previously described amino acid change Y361H [11], estimated to be present in 50% of viral genomes. The sf-J4(1b) had acquired amino acid changes T578A and D584G, estimated to be present in the majority of viral genomes. Relative recovery per fraction (%) was calculated by relating the amount of infectious virus detected in each fraction to the total amount of infectious virus collected, and is plotted against the density determined for each fraction.
Figure 6
Figure 6. HCVcc and sf-HCVcc showed similar association with ApoE
(A) Monoclonal α-ApoE antibody (1D7) and control mouse IgG1κ (1D1) were diluted in DMEM + 10% FBS to the indicated concentrations. SA13(5a) (black bars) and sf-SA13(5a) (grey bars) were diluted in DMEM + 10% FBS and incubated with dilutions of α-ApoE or mouse IgG1κ for 30 minutes at 37°C. The virus-antibody mixes were added to Huh7.5 cells, plated the previous day in poly-D-lysine coated 96 well plates. After 3 hours of incubation, virus-antibody mixes were removed and DMEM + 10% FBS was added. Cells were fixed 48 hours post infection and stained, and the number of single HCV NS5A positive cells per well was determined by automated counting as described in Materials and Methods. The % neutralization was calculated by relating counts of experimental wells to the mean count of six replicate wells with untreated control virus. Data points are means of three replicates with SEM (error bars). Following logarithmic transformation of X-values, variable-slope sigmoidal dose-response curves were fitted [Y = Bottom+(Top-Bottom)/(1 + 10(Log10EC50-X)×HillSlope)]. “Bottom” was constrained to “0” for all curves. “Top” was constrained to “100”. (B) Immunoprecipitation was carried out on 106 IU HCV RNA of SA13(5a) and sf-SA13(5a), using monoclonal α-ApoE (1D7) and control mouse IgG1κ (1D1) as described in Materials and Methods. Amounts of HCV RNA (IU) were determined in the immunoprecipitated fractions using TaqMan PCR as described in Materials and Methods. RNA titers are shown as the mean of two replicates with SEM.
Figure 7
Figure 7. FBS enhances infectivity of both HCVcc and sf-HCVcc
(A-C) Huh7.5 cells seeded in poly-D-lysine coated 96-well plates the previous day, were incubated with (A) SA13(5a) and sf-SA13(5a) diluted in DMEM + 10% FBS (black bars) or AEM (grey bars), (B) sf-SA13(5a) diluted in different media with supplements as indicated or (C) sf-SA13(5a) diluted in AEM supplemented with different concentrations of FBS. % FBS in growth medium indicates the final FBS concentration. (A–C) Cells were incubated with virus mixes for 3 hours. After incubation, fresh DMEM + 10% FBS was added to all wells. Cells were incubated for 48 hours before they were fixed, stained and the number of single HCV NS5A positive cells per well was determined by automated counting as described in Materials and Methods. Error bars represent SEM of triplicates. For (B), the mean infectivity (HCV NS5A positive cells/well) of triplicate wells of the reference culture (DMEM + 10% FBS, black bar) was set to 100%. The number of HCV NS5A positive cells / experimental well was related to this mean to calculate % infectivity relative to the reference culture.
Figure 8
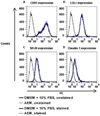
Figure 8. Huh7.5 cells cultured in DMEM + 10% FBS or AEM showed similar surface expression of HCV co-receptors
Huh7.5 cells were incubated for 3 hours in DMEM + 10% FBS or AEM and subsequently prepared for flow cytometry analysis as described in Materials and Methods. Cell surface expression of HCV co-receptors was determined using antibodies against (A) CD81, (B) LDL-r, (C) SR-BI and (D) claudin-1 as described in Materials and Methods. PE signals were recorded on a BD FACSCalibur flow cytometer. Histograms show the co-receptor surface expression in cells cultured in DMEM + 10% FBS (dark blue) or AEM (light blue) compared to unstained cells (black and grey, respectively).
Figure 9
Figure 9. The sf-HCVcc density profile was maintained afterin vitro incubation with serum
The sf-SA13(5a) recombinant was mixed 1:1 with either 100% FBS, DMEM + 10% FBS, DMEM, AEM, 100% human serum or sterile filtered cell culture conditioned medium (DMEM + 10% FBS harvested after 48 hours culture on naïve Huh7.5 cells) and incubated for 6 hours at 37°C. Mixes were layered on top of a pre-formed 10–40% iodixanol gradient, and subjected to ultracentrifugation as described in Materials and Methods. Fractions were collected from the bottom of the gradients and analyzed by infectivity titration and by density determination as described in Materials and Methods. Relative recovery per fraction (%) was calculated by relating the amount of infectious virus detected in each fraction to the total amount of infectious virus collected, and is plotted against the density determined for each fraction.
Figure 10
Figure 10. Effect of co-receptor blocking on HCVcc and sf-HCVcc entry
α-CD81 (left column), α-LDLr (middle column) or α-SR-BI (right column) was diluted in DMEM + 10% FBS to the indicated concentrations. Specified antibody (open symbols) or control antibody (closed symbols) dilutions were added to Huh7.5 cells, plated the previous day onto poly-D-lysine coated 96-well plates and incubated for 1 hour. HCVcc (black circles) were diluted in DMEM + 10% FBS and sf-HCVcc (grey squares) were diluted in AEM + 10% FBS and added to cultures. After 6 hours incubation, antibody-virus mixes were removed and DMEM + 10% FBS was added. Cells were fixed 48 hours post infection and stained, and the number of single HCV NS5A positive cells per well was determined by automated counting as described in Materials and Methods. The HCV Core-E2 sequences of all virus stocks used were determined by direct sequencing. Sequences were identical for HCVcc and sf-HCVcc of the same recombinant. Compared to the plasmid sequence, H77(1a) viruses had acquired amino acid change I348S and J4(1b) had acquired amino acid change V710L, both estimated to be present in the majority of viral genomes. The % blocking was calculated by relating counts of experimental wells to the mean count of six replicate wells with untreated control virus. Data points are means of three replicates with SEM (error bars). Following logarithmic transformation of X-values, variable-slope sigmoidal dose-response curves were fitted [Y = Bottom+(Top-Bottom)/(1 + 10(Log10EC50-X)×HillSlope)]. “Bottom” was constrained to “0”. Bmax values, the Y values at the top plateaus of the fitted curves, are shown for HCVcc (black) and sf-HCVcc (grey). No curve could be fitted to data points obtained for sf-HK6a(6a) in SR-BI blocking experiments. ND, not determinable.
Figure 11
Figure 11. Effect of chlorpromazine treatment on HCVcc and sf-HCVcc entry
(A-G) Chlorpromazine was diluted in DMEM + 10% FBS to the concentrations indicated and then added to Huh7.5 cells, plated the previous day onto poly-D-lysine coated 96-well plates, and incubated for 30 minutes. HCVcc (black bars) were diluted in DMEM + 10% FBS and sf-HCVcc (grey bars) were diluted in AEM + 10% FBS and added to cultures. After 6 hours incubation, chlorpromazine-virus mixes were removed and DMEM + 10% FBS was added. Cells were fixed 48 hours post infection and stained, and the number of single HCV NS5A positive cells per well was determined by automated counting as described in Materials and Methods. The HCV Core-E2 sequences of all virus stocks used were determined by direct sequencing. Sequences were identical for HCVcc and sf-HCVcc of the same recombinant. Compared to the plasmid sequence, H77(1a) viruses had acquired amino acid change I348S and J4(1b) had acquired amino acid change V710L, both estimated to be present in the majority of viral genomes. The % blocking was calculated by relating counts of experimental wells to the mean count of six replicate wells with untreated control virus. Data points are means of three replicates with SEM (error bars). (H) Chlorpromazine was diluted in DMEM + 10% FBS to the concentrations indicated and then added to Huh 7.5 cells, plated the previous day in poly-D-lysine coated 96-well plates. Cells were incubated for 6 hours before chlorpromazine was removed and DMEM + 10% FBS was added. A cell viability assay was carried out on cells incubated for 6 hours with chlorpromazine and on control cultures as described in Materials and Methods (0 hrs post treatment; dashed bars). An additional cell viability assay was carried out on chlorpromazine treated- and control cultures 48 hours post treatment (white bars). The % viability was calculated by relating absorbance at 490 nm determined for chlorpromazine treated cultures to the mean absorbance of three replicate untreated cultures. Bars represent the means of three replicates with SEM. *, values <0.
Figure 12
Figure 12. HCVcc and sf-HCVcc show similar sensitivity to neutralization with genotype 1a chronic-phase patient serum
Genotype 1a serum H06 was diluted in DMEM + 10% FBS as indicated. HCVcc (black circles) were diluted in DMEM + 10% FBS and sf-HCVcc (grey squares) were diluted in AEM + 10% FBS, mixed with H06 serum dilutions and incubated 1 hour at 37°C. Virus-serum mixes were added to Huh7.5 cells, plated the previous day onto poly-D-lysine coated 96 well plates. After 6 hours incubation, virus-serum mixes were removed and DMEM + 10% FBS was added. Cells were fixed 48 hours post infection and stained, and the number of single HCV NS5A positive cells per well was determined by automated counting as described in Materials and Methods. The HCV Core-E2 sequences of all virus stocks used were determined by direct sequencing. Sequences were identical for HCVcc and sf-HCVcc of the same recombinant. Compared to the plasmid sequence, H77(1a) viruses had acquired amino acid change I348S and J4(1b) had acquired amino acid change V710L, both estimated to be present in the majority of viral genomes. The % neutralization was calculated by relating counts of experimental wells to the mean count of six replicate wells with untreated control virus. Data points are means of three replicates with SEM (error bars). Following logarithmic transformation of X-values, variable-slope sigmoidal dose-response curves were fitted [Y = Bottom+(Top-Bottom)/(1 + 10(Log10EC50-X)×HillSlope)]. “Bottom” was constrained to “0” for all curves. “Top” was constrained to “100” for all curves in all panels except D; for these curves, median inhibitory concentrations (IC50) were calculated (black for HCVcc and grey for sf-HCVcc). ND, not determinable.
Figure 13
Figure 13. SA13(5a) and sf-SA13(5a) show similar susceptibility to genotype 5a patient serum and human monoclonal antibodies
(A) Genotype 5a chronic phase serum SA3 or (B-F) monoclonal antibodies AR1B and AR2A-5A were diluted in DMEM + 10% FBS as indicated. HCVcc (black circles) were diluted in DMEM + 10% FBS and sf-HCVcc (grey squares) were diluted in AEM + 10% FBS, mixed with SA3 serum, AR1B or AR2A-5A antibody dilutions and incubated 1 hour at 37°C. Virus-serum or virus-antibody mixes were added to Huh7.5 cells, plated the previous day in poly-D-lysine coated 96 well plates. After 6 hours incubation, virus-serum or virus-antibody mixes were removed and DMEM + 10% FBS was added. Cells were fixed 48 hours post infection and stained, and the number of single HCV NS5A positive cells per well was determined by automated counting as described in Materials and Methods. The % neutralization was calculated by relating counts of experimental wells to the mean count of six replicate wells with untreated control virus. Data points are means of three replicates with SEM (error bars). Following logarithmic transformation of X-values, variable-slope sigmoidal dose-response curves were fitted [Y = Bottom+(Top-Bottom)/(1 + 10(Log10EC50-X)×HillSlope)]. “Bottom” was constrained to “0” for all curves. “Top” was constrained to “100” for all curves. Median inhibitory concentrations (IC50) were calculated (black for HCVcc and grey for sf-HCVcc).

Similar articles

Cited by

References

    1. Fauvelle C, Lepiller Q, Felmlee DJ, Fofana I, Habersetzer F, Stoll-Keller F, et al. Hepatitis C virus vaccines – Progress and perspectives. Microb. Pathog. 2013;58:66–72. - PubMed
    1. Alter HJ, Seeff LB. Recovery, Persistence, and Sequelae in Hepatitis C Virus Infection: A Perspective on Long-Term Outcome. Semin. Liver Dis. 2000;20:0017–0036. - PubMed
    1. Simmonds P, Bukh J, Combet C, Deléage G, Enomoto N, Feinstone S, et al. Consensus proposals for a unified system of nomenclature of hepatitis C virus genotypes. Hepatology. 2005;42:962–973. - PubMed
    1. Gottwein JM, Bukh J. Chapter 2 Cutting the Gordian Knot-Development and Biological Relevance of Hepatitis C Virus Cell Culture Systems. Adv. Virus Res. 2008;71:51–133. - PubMed
    1. Amoroso P, Rapicetta M, Tosti ME, Mele A, Spada E, Buonocore S, et al. Correlation between virus genotype and chronicity rate in acute hepatitis C. J. Hepatol. 1998;28:939–944. - PubMed

Publication types

Substances