. 2014 Oct;192(4):1238-48.
doi: 10.1016/j.juro.2014.05.115. Epub 2014 Jun 10.

H2O2 generation by bacillus Calmette-Guérin induces the cellular oxidative stress response required for bacillus Calmette-Guérin direct effects on urothelial carcinoma biology

Affiliations

H2O2 generation by bacillus Calmette-Guérin induces the cellular oxidative stress response required for bacillus Calmette-Guérin direct effects on urothelial carcinoma biology

Gopitkumar Shah et al. J Urol. 2014 Oct.

Abstract

Purpose: Exposure of urothelial carcinoma cells to bacillus Calmette-Guérin affects cellular redox status and tumor cell biology but the mechanism(s) remain unclear. We examined free radical production by bacillus Calmette-Guérin in tumor cells in response to the bacillus using global profiling of reactive oxygen species/reactive nitrogen species. The relationship between free radical generation and downstream cellular events was evaluated.

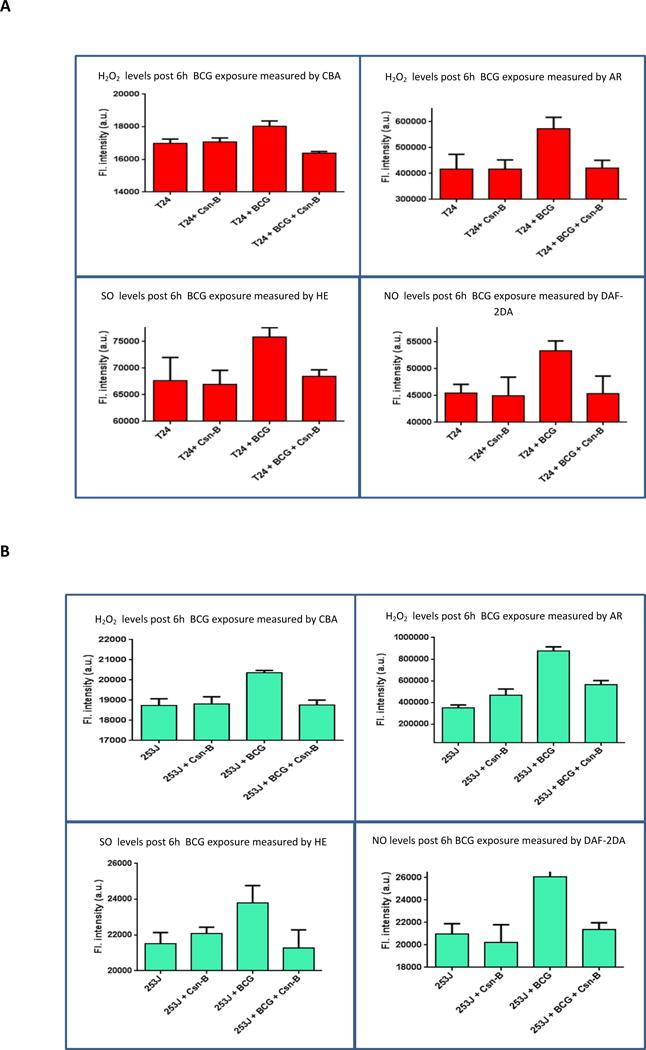
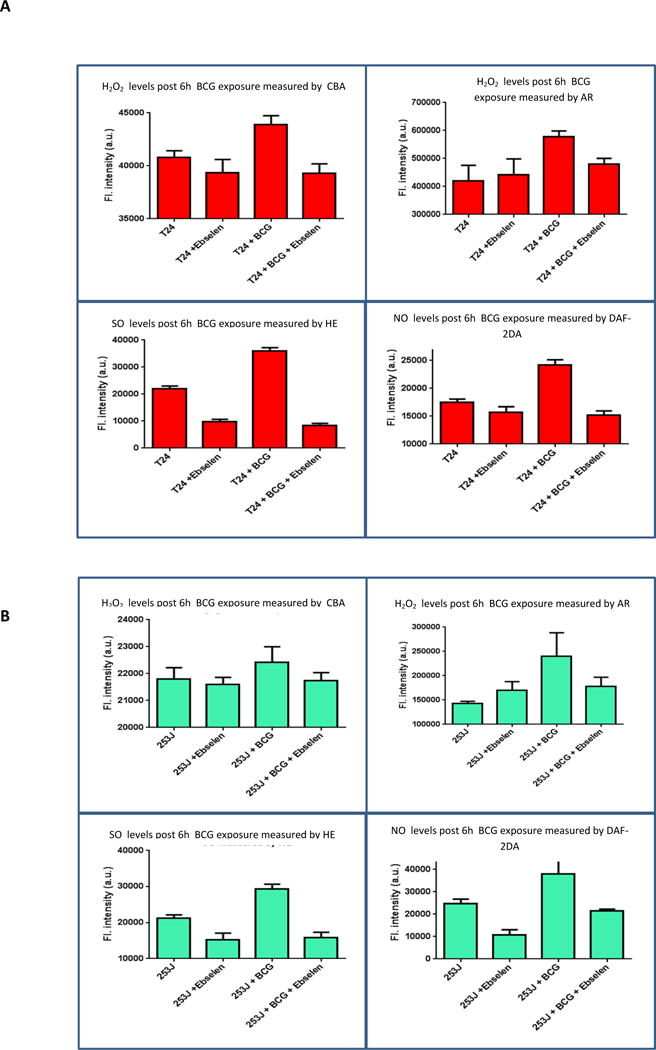
Materials and methods: Using fluorescent probes we performed global profiling of reactive oxygen species/reactive nitrogen species in heat killed and viable bacillus Calmette-Guérin, and in the 253J and T24 urothelial carcinoma cell lines after exposure to the bacillus. Inhibition of bacillus Calmette-Guérin internalization and H2O2 pharmacological scavenging were studied for their effect on cellular reactive oxygen species/reactive nitrogen species generation and various physiological end points.

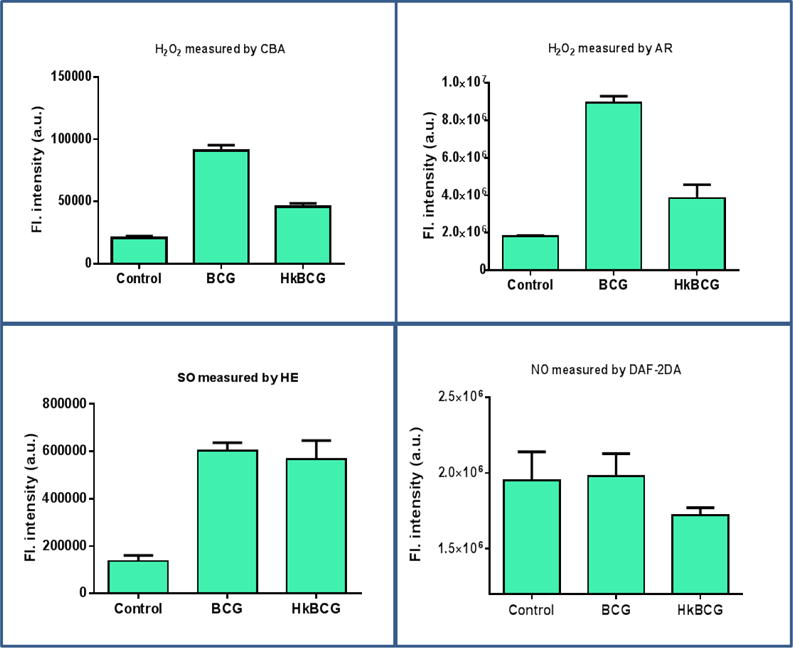
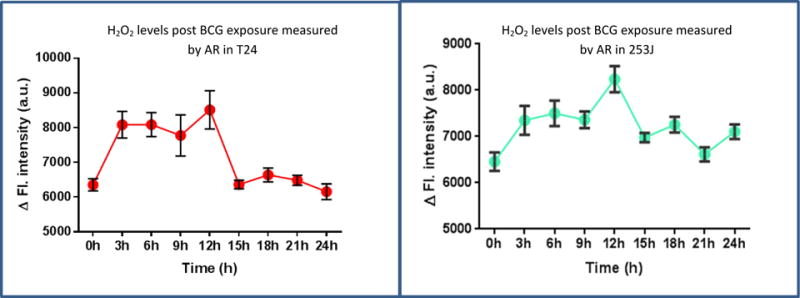
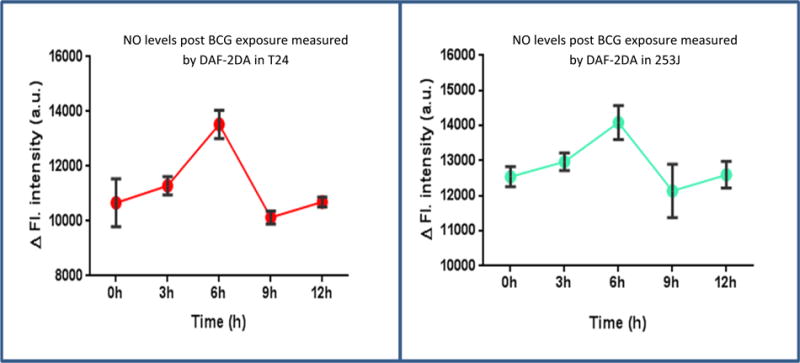
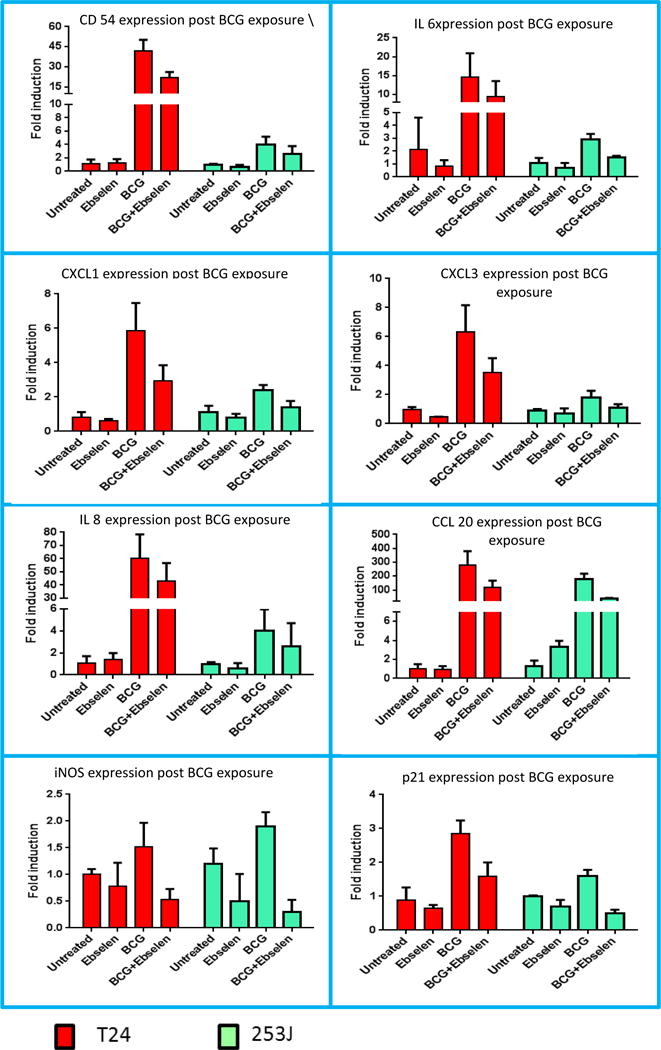
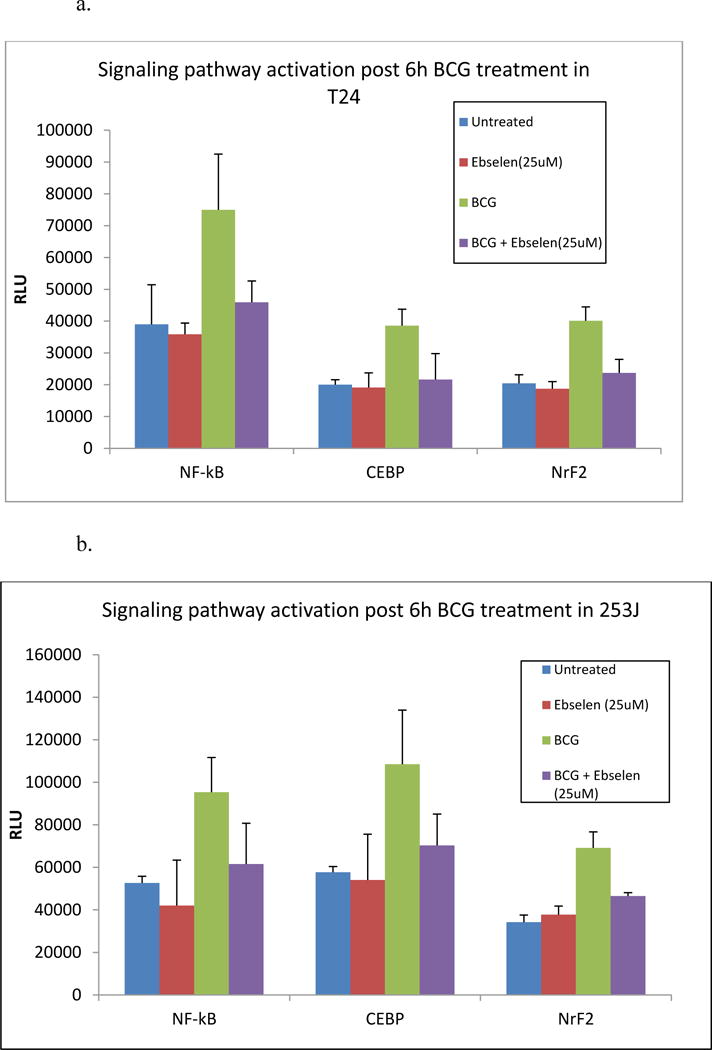
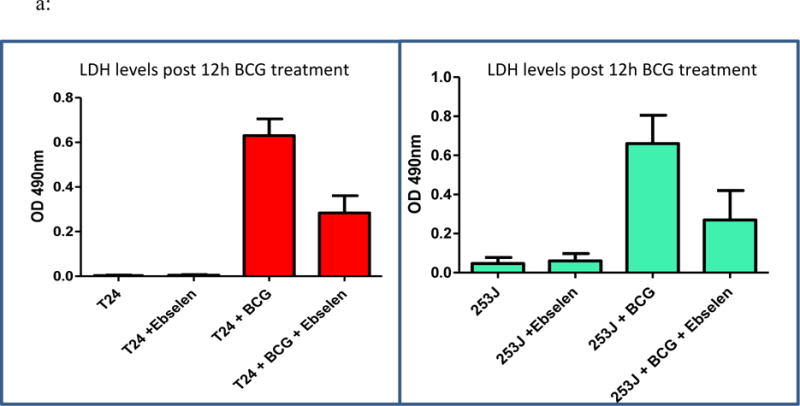
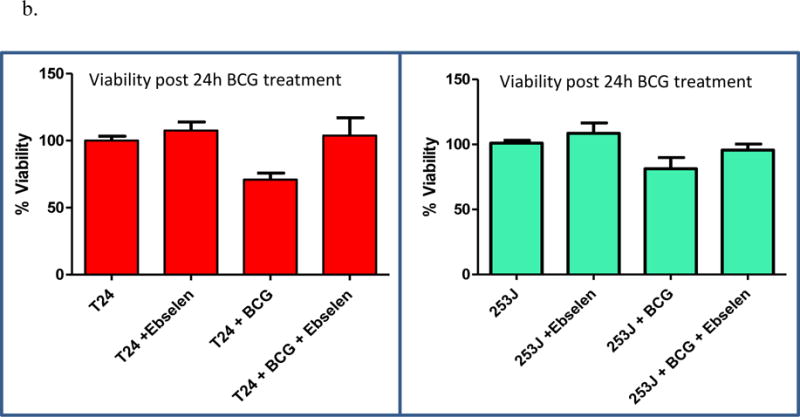
Results: Viable bacillus Calmette-Guérin produced H2O2 and O2(-) but nitric oxide was not generated. Loss of viability decreased H2O2 production by 50% compared to viable bacillus. Bacillus Calmette-Guérin internalization was necessary for the bacillus to induce reactive oxygen species/reactive nitrogen species generation in urothelial carcinoma cells. Pharmacological H2O2 scavenging reversed reactive oxygen species/reactive nitrogen species mediated signaling in urothelial carcinoma cells. Bacillus Calmette-Guérin dependent alterations in tumor biology, including intracellular signaling, gene expression and cytotoxicity, depended on free radical generation.

Conclusions: This study demonstrates the importance of free radical generation by bacillus Calmette-Guérin and intracellular generation of cellular oxidative stress on the urothelial carcinoma cell response to the bacillus. Manipulating the cellular oxidative stress induced by bacillus Calmette-Guérin represents a potential target to increase the efficacy of the bacillus.

Keywords: BCG vaccine; carcinoma; free radicals; oxidative stress; urinary bladder.


Figures

Figure 1
Figure 1
Global profiling of ROS/RNS generation by BCG. ROS/RNS generation was measured using different fluorescent probes a) H2O2 was measured by CBA and AR b) Superoxides were measured by HE c) NO was measured by DAF-2DA. BCG produces H2O2 and O2 as but do not generate NO. H2O2 production by BCG is affected by viability. Hk BCG produced decreased amount of H2O2 compared to freshly reconstituted BCG (p < 0.001). O2 production was not affected by viability as there was no significant difference in viable and hkBCG group (P = 0.1)
Figure 2
Figure 2
Real time global profiling of ROS post BCG exposure: T24 and 253J cell lines were exposed to BCG and H2O2 was measured using AR at different time points post BCG exposure. Exposure of UC cells to BCG significantly increased the levels of H2O2 generation. The increase could be detected from 3h till 12 h (p < 0.001) in T24. In 253J, increase in H2O2 could be detected from 3h onwards till 18h post BCG exposure h (p < 0.01). Values on Y axis show the difference between “time correct” control and BCG treated cells.
Figure 3
Figure 3
Effect of BCG on real time global profiling of RNS: T24 and 253J cell lines were exposed to BCG and NO levels were measured using DAF-2DA at different time points post BCG exposure. NO levels starts peaking up at 3h and reach to significantly higher levels at 6h in both T24 (p < 0.01) and 253J (p < 0.01) cell lines compared to control. No significant difference in NO levels between control and treated group were observed 6h onwards (T24, P = 0.57; 253J, p = 0.28). Values on Y axis show the difference between “time correct” control and BCG treated cells.
Figure 4
Figure 4
Effect of BCG internalization on real time ROS/RNS profiling: T24 and 253J cells were exposed to BCG for 6h. Post BCG exposure, H2O2 levels were measured using CBA and AR, O2 levels were measured using HE and NO levels were measured using DAF-2DA. Treatment groups included Untreated, Cytochalasin-B treated, BCG treated and BCG with cytochalasin-B. H2O2, O2 and NO levels significantly decreased in the BCG with cytochalasin-b treatment group in both cell lines, relative to BCG alone. (p < 0.05 for H2O2, p < 0.01 for O2 and p < 0.05 for NO). The difference in Cytochalasin-b control group and cytochalasin-b plus BCG group was statistically non-significant (p = 0.4).
Figure 5
Figure 5
Effect of ebselen on real time ROS/RNS global profiling: T24 and 253J cells were exposed to BCG for 6h. Post BCG exposure. H2O2 levels were measured using CBA and AR, O2 levels were measured using HE and NO levels were measured using DAF-2DA. Treatment groups included Untreated, ebselen treated, BCG treated and BCG with ebselen. Compared to the BCG treated group, BCG with ebselen treated group had significantly reduced levels of ROS/RNS. (p < 0.05 for H2O2, p < 0.001 for O2 and NO). The difference in ebselen control group and ebselen plus BCG group was statistically non-significant (p = 0.7).
Figure 6
Figure 6
Effect of free radical scavenger on Gene Expression: T24 and 253J cells were exposed to BCG. Post BCG exposure, gene expression of various genes was measured using q-RT PCR. Treatment groups included untreated, ebselen treated, BCG treated and BCG with ebselen. BCG exposure resulted in significant increased the expression of 8 immune response genes as measured by qRTPCR in both cell lines (ANOVA, p < 0.05). Ebselen in combination with BCG reduced UC cell expression of all measured genes with 7 of 8 and 6 of 8 reaching the level of statistical significance in 253J and T24 cells respectively (ANOVA, P < 0.05).
Figure 7
Figure 7
Effect of ebselen on signaling pathways: T24 and 253J cells were exposed to BCG for 6h. Treatment groups included Untreated, ebselen treated, BCG treated and BCG with ebselen. BCG exposure significantly increased activation of NF-κB, CEBP and NrF2 luciferase reporter construct in both cell lines (p < 0.01). Ebselen in combination with BCG significantly reduced NF-κB (p < 0.01), CEBP (p < 0.05) and NrF2 (p < 0.05) reporter activation.
Figure 8
Figure 8
a: Effect of ebselen on BCG cytotoxicity: T24 and 253J cells were exposed to BCG for 12 or 24h. Treatment groups included Untreated, ebselen treated, BCG treated and BCG with ebselen. BCG exposure significantly increased LDH release in T24 and 253J cells (p < 0.001). Ebselen pretreatment significantly decreased LDH release relative to BCG alone in both cell lines after 12 h (T24 p < 0.001; 253J p < 0.01). b: BCG exposure for 24 h significantly inhibited cell proliferation in 253J and T24 cells, respectively (T24 p < 0.005; 253J p < 0.05). Treatment of cells with ebselen prior to BCG treatment inhibited BCG’s antiproliferative/cytotoxic effect in 253J and T24 cells (p < 0.05).
Figure 8
Figure 8
a: Effect of ebselen on BCG cytotoxicity: T24 and 253J cells were exposed to BCG for 12 or 24h. Treatment groups included Untreated, ebselen treated, BCG treated and BCG with ebselen. BCG exposure significantly increased LDH release in T24 and 253J cells (p < 0.001). Ebselen pretreatment significantly decreased LDH release relative to BCG alone in both cell lines after 12 h (T24 p < 0.001; 253J p < 0.01). b: BCG exposure for 24 h significantly inhibited cell proliferation in 253J and T24 cells, respectively (T24 p < 0.005; 253J p < 0.05). Treatment of cells with ebselen prior to BCG treatment inhibited BCG’s antiproliferative/cytotoxic effect in 253J and T24 cells (p < 0.05).

References

    1. Babjuk M, Oosterlinck W, Sylvester R, et al. EAU guidelines on non-muscle-invasive urothelial carcinoma of the bladder, the 2011 update. Eur Urol. 2011;59:997. - PubMed
    1. Kassouf W, Kamat AM, Zlotta A, et al. Canadian guidelines for treatment of non-muscle invasive bladder cancer: a focus on intravesical therapy. Can Urol Assoc J. 2010;4:168. - PMC - PubMed
    1. Luo Y, Askeland EJ, Newton M, et al. Immunotherapy of Urinary Bladder Carcinoma: BCG and Beyond. Advances in Urology. 2012:181987. - PMC - PubMed
    1. Pook SH, Esuvaranathan K, Mahendran R. N-acetylcysteine augments the cellular redox changes and cytotoxic activity of internalized Mycobacterium bovis in human bladder cancer cells. J Urol. 2002;168:780. - PubMed
    1. Méndez-Samperio P, Pérez A, Torres L. Role of reactive oxygen species (ROS) in Mycobacterium bovis Bacillus Calmette-Guerin mediated up-regulation of the human cathelicidin LL-37 in A549 cells. Microb Pathog. 2009;47:252. - PubMed

MeSH terms