. 2014 Aug 15;289(33):22672-22691.
doi: 10.1074/jbc.M114.552141. Epub 2014 Jun 13.

High mobility group box-1 (HMGB1) participates in the pathogenesis of alcoholic liver disease (ALD)

Affiliations

High mobility group box-1 (HMGB1) participates in the pathogenesis of alcoholic liver disease (ALD)

Xiaodong Ge et al. J Biol Chem. .

Erratum in

  • J Biol Chem. 2014 Aug 15;289(33):22671

Abstract

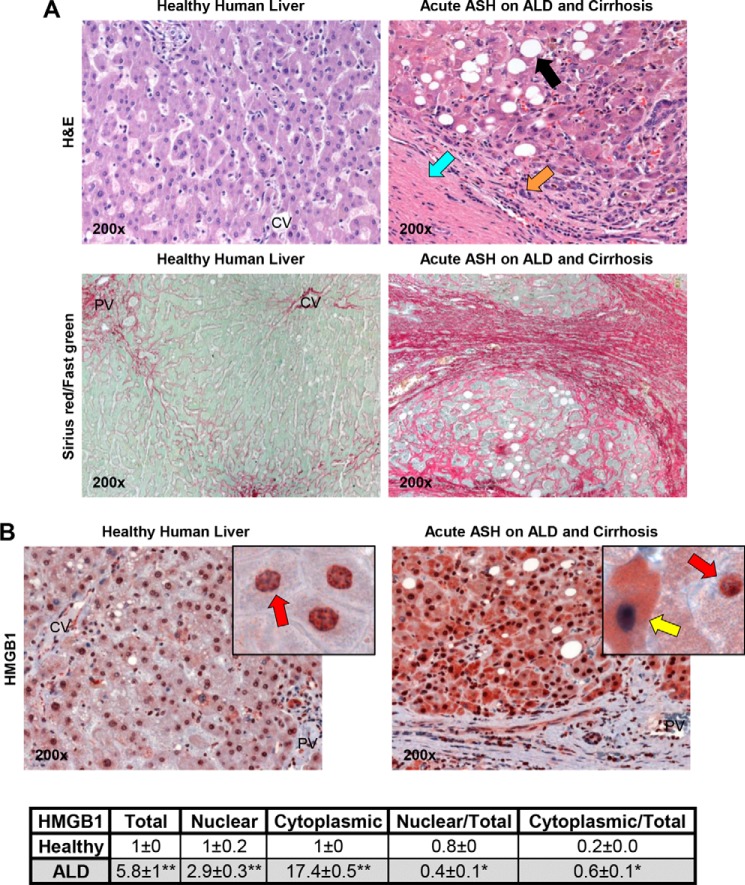
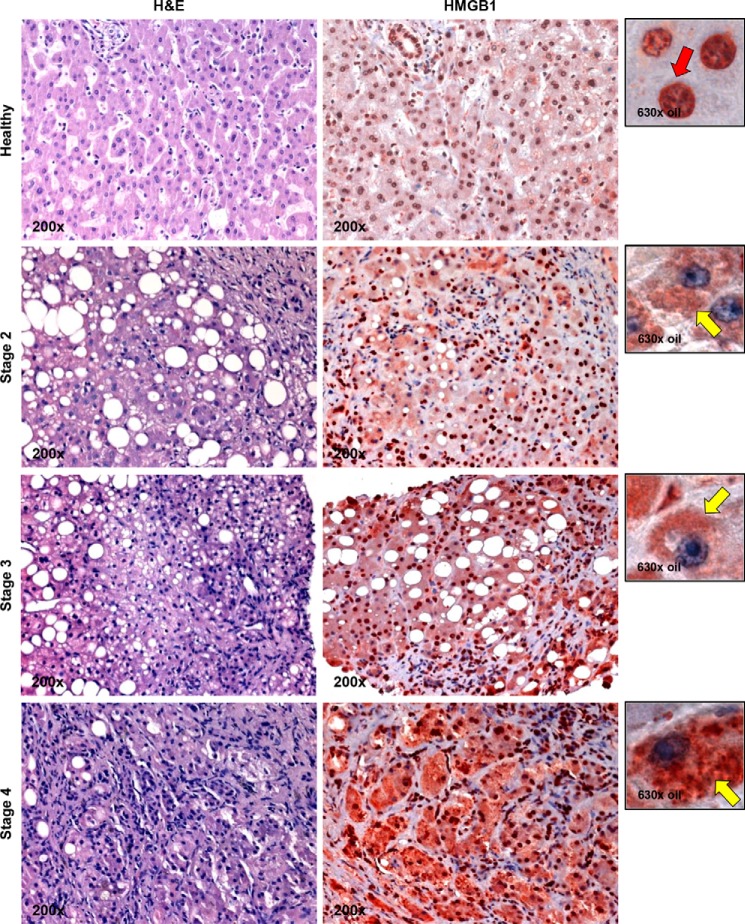
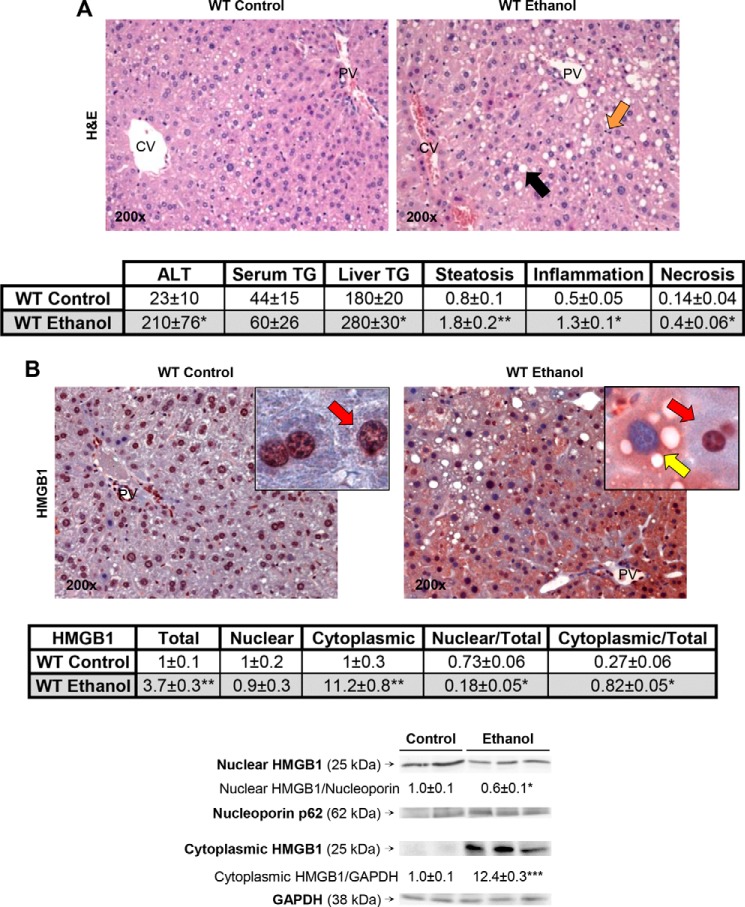
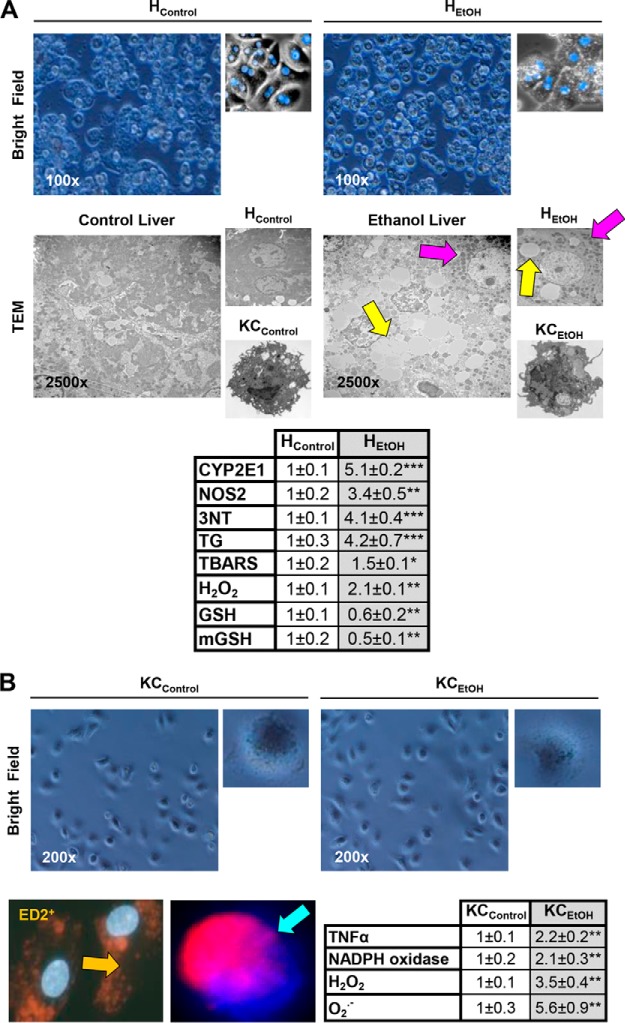
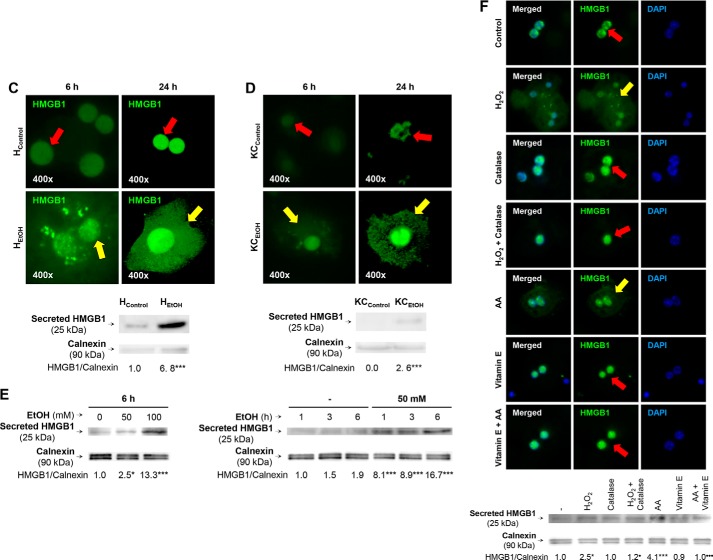
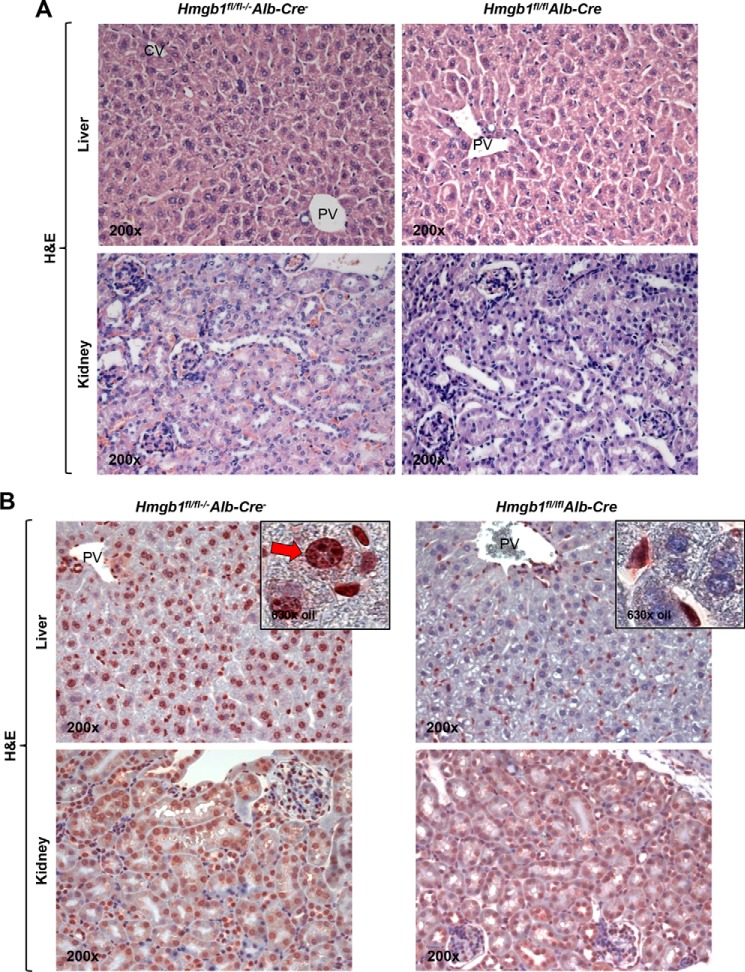
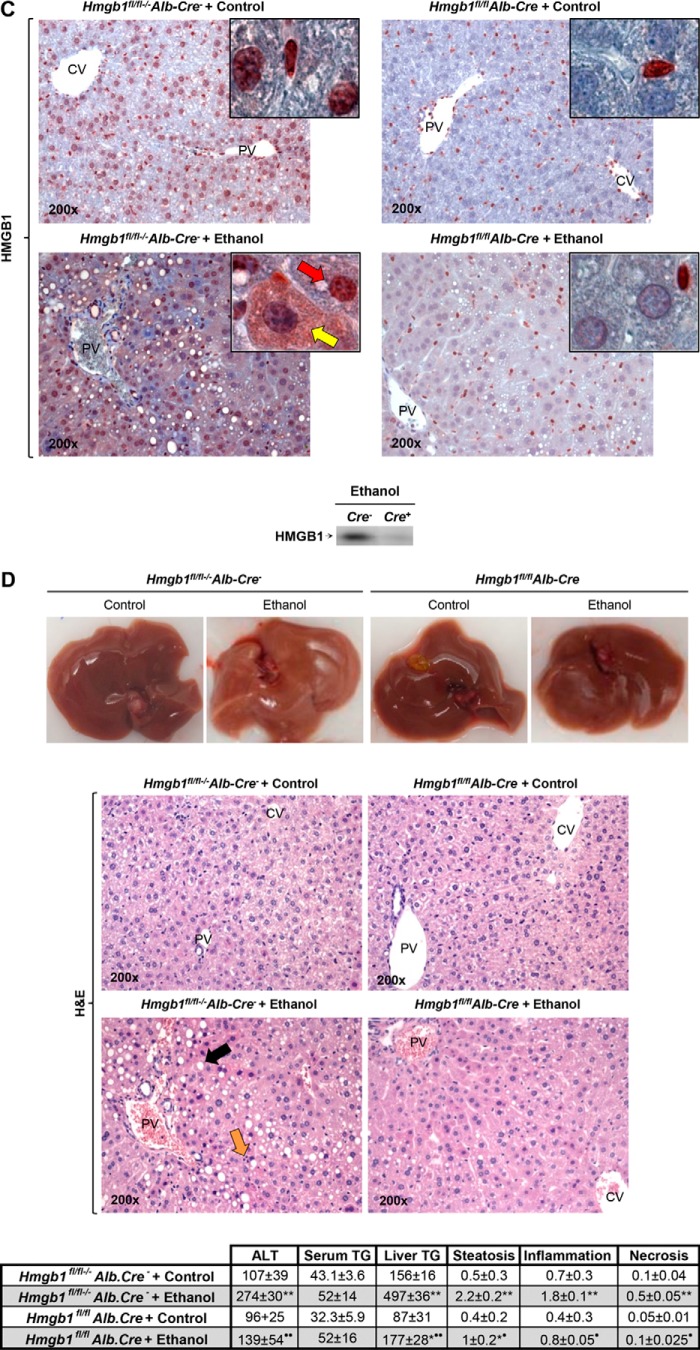
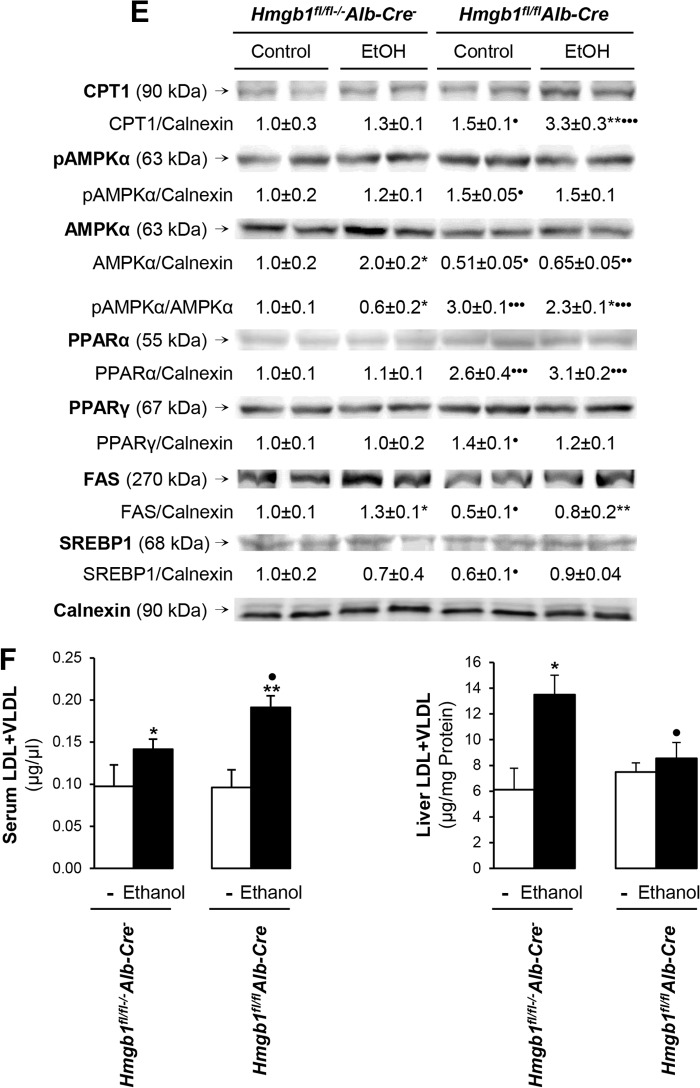
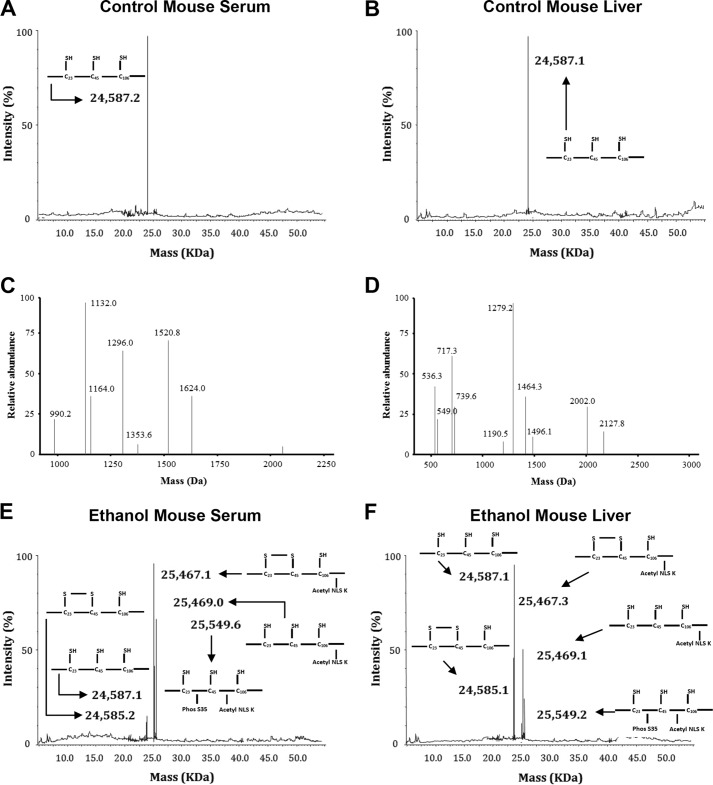
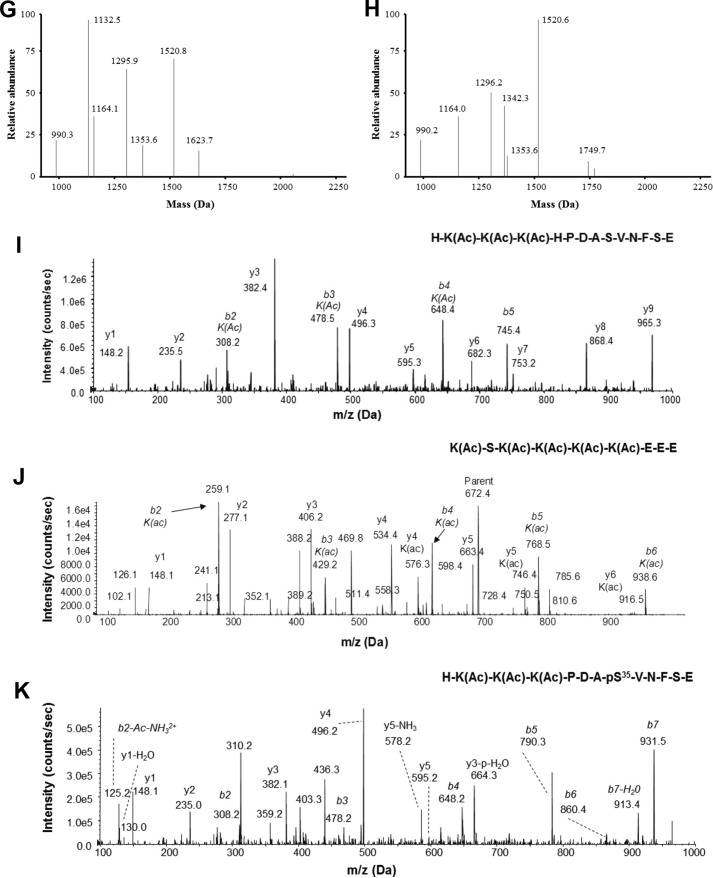
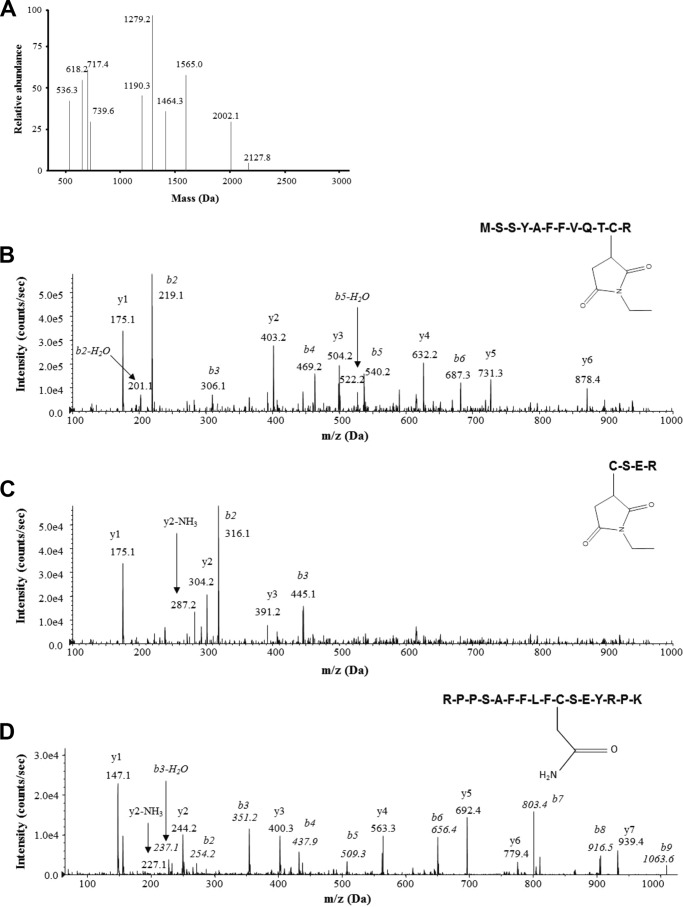
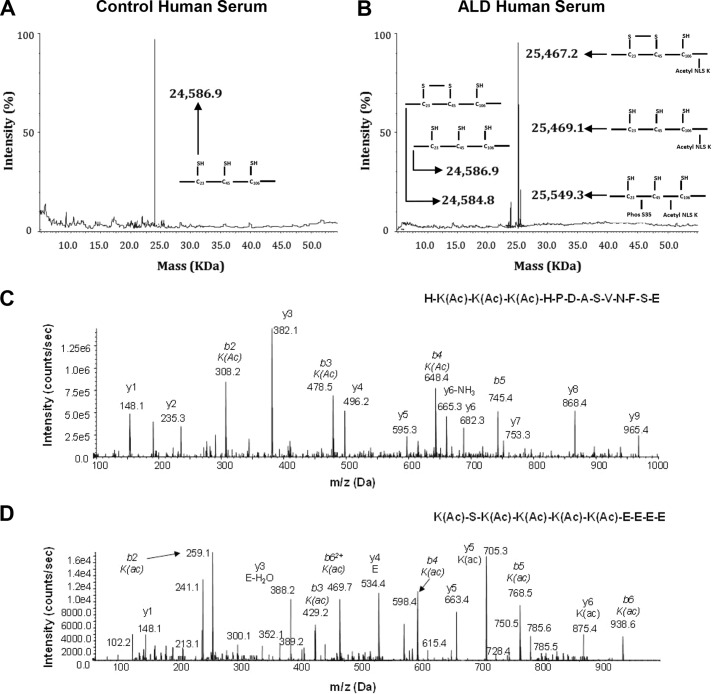
Growing clinical and experimental evidence suggests that sterile inflammation contributes to alcoholic liver disease (ALD). High mobility group box-1 (HMGB1) is highly induced during liver injury; however, a link between this alarmin and ALD has not been established. Thus, the aim of this work was to determine whether HMGB1 contributes to the pathogenesis of ALD. Liver biopsies from patients with ALD showed a robust increase in HMGB1 expression and translocation, which correlated with disease stage, compared with healthy explants. Similar findings were observed in chronic ethanol-fed wild-type (WT) mice. Using primary cell culture, we validated the ability of hepatocytes from ethanol-fed mice to secrete a large amount of HMGB1. Secretion was time- and dose-dependent and responsive to prooxidants and antioxidants. Selective ablation of Hmgb1 in hepatocytes protected mice from alcohol-induced liver injury due to increased carnitine palmitoyltransferase-1, phosphorylated 5'AMP-activated protein kinase-α, and phosphorylated peroxisome proliferator-activated receptor-α expression along with elevated LDL plus VLDL export. Native and post-translationally modified HMGB1 were detected in humans and mice with ALD. In liver and serum from control mice and in serum from healthy volunteers, the lysine residues within the peptides containing nuclear localization signals (NLSs) 1 and 2 were non-acetylated, and all cysteine residues were reduced. However, in livers from ethanol-fed mice, in addition to all thiol/non-acetylated isoforms of HMGB1, we observed acetylated NLS1 and NLS2, a unique phosphorylation site in serine 35, and an increase in oxidation of HMGB1 to the disulfide isoform. In serum from ethanol-fed mice and from patients with ALD, there was disulfide-bonded hyperacetylated HMGB1, disulfide-bonded non-acetylated HMGB1, and HMGB1 phosphorylated in serine 35. Hepatocytes appeared to be a major source of these HMGB1 isoforms. Thus, hepatocyte HMGB1 participates in the pathogenesis of ALD and undergoes post-translational modifications (PTMs) that could condition its toxic effects.

Keywords: Alcohol; Hepatocyte; High Mobility Group Box 1; Inflammation; Liver; Post-translational Modification (PTM).


Figures

FIGURE 1.
FIGURE 1.
Liver biopsies from patients with ASH superimposed on ALD and cirrhosis show significant increase in HMGB1 expression and translocation from the nucleus to the cytoplasm compared with wedge samples from healthy human lobectomy specimens. H&E staining shows significant steatosis (black arrow), inflammation (orange arrow), and cirrhosis (blue arrow), and Sirius red/fast green staining shows total collagen (red) in healthy human lobectomy specimens and liver needle biopsies from patients with clinically proven acute ASH superimposed on ALD and cirrhosis (A). In HMGB1 IHC, the red arrows indicate HMGB1 positive staining in the nucleus and -negative staining in the cytoplasm, and the yellow arrow points to HMGB1-negative staining in the nucleus and -positive staining in the cytoplasm (B, top). Morphometry assessment of total, nuclear, and cytoplasmic HMGB1 expression as well as the ratios of nuclear versus total and cytoplasmic versus total HMGB1 expression is shown (B, bottom). n = 10/group. *, p < 0.05; **, p < 0.01 for ALD versus healthy.
FIGURE 2.
FIGURE 2.
HMGB1 induction and translocation correlate with disease stage in human ALD. IHC for HMGB1 in a set of human liver biopsies that are healthy or stage 2 (mild), 3 (significant), and 4 (severe) ALD classified according to the Brunt scoring system (40) is shown. The red arrow indicates HMGB1-positive staining in the nucleus and -negative staining in the cytoplasm, and the yellow arrows point to HMGB1-negative staining in the nucleus and -positive staining in the cytoplasm.
FIGURE 3.
FIGURE 3.
Alcohol intake enhances HMGB1 expression and translocation from the nucleus to the cytoplasm in WT mice. WT mice were fed for 7 weeks either the control or the ethanol Lieber-DeCarli diet. H&E staining (steatosis (back arrow), inflammation (orange arrow)), serum alanine aminotransferase (ALT) activity (units/liter), serum triglycerides (TG) (mg/dl), and liver triglycerides (mg/g of protein) along with the scores for steatosis, inflammation, and necrosis classified according to the Brunt scoring system (40) are shown (A). IHC shows that ethanol feeding increases HMGB1 expression in WT mice. The red arrows indicate HMGB1-positive staining in the nucleus and -negative staining in the cytoplasm, and the yellow arrow points to HMGB1-negative staining in the nucleus and -positive staining in the cytoplasm (B, top). Morphometry assessment of total, nuclear, and cytoplasmic HMGB1 as well as the ratios of nuclear versus total and cytoplasmic versus total HMGB1 expression is shown (B, middle). Western blot analysis of cytoplasmic and nuclear HMGB1 is also shown (B, bottom). n = 10/group. *, p < 0.05; **, p < 0.01; ***, p < 0.001 for ethanol versus control.
FIGURE 4.
FIGURE 4.
Primary hepatocytes and Kupffer cells from control and ethanol-fed mice retain their phenotype in vitro. Primary hepatocytes and Kupffer cells were isolated from mice fed the control or the ethanol Lieber-DeCarli diet for 7 weeks (HControl, HEtOH, KCControl, and KCEtOH) and cultured for up to 48 h. Bright field pictures along with pictures from hepatocytes fixed and stained with DAPI (blue) are shown (A, top). Transmission electron microscopy pictures from liver, hepatocytes, and Kupffer cells from control and ethanol-fed mice (the yellow arrows point to lipid droplets, and the pink arrows point to electron-dense mitochondria) are shown (A, middle). -Fold change of markers of injury in HControl and HEtOH is similar to what occurs in vivo (A, bottom). Bright field pictures from Kupffer cells (B, top) are shown. Cultured Kupffer cells were fixed and stained with DAPI and ED2 (orange arrow) or evaluated for phagocytic activity of fluorescent red nanoparticles (blue arrow) (B, bottom left). -Fold change in markers of injury in KCControl and KCEtOH is similar to what occurs in vivo (B, bottom right). n = 6. *, p < 0.05; **, p < 0.01; ***, p < 0.001 for ethanol versus control. HMGB1 induction, translocation, and secretion in hepatocytes are critical for alcohol-induced liver injury. Immunofluorescence analysis for HMGB1 expression in HControl and HEtOH (C, top) and KCControl and KCEtOH (D, top) at 6 and 24 h post-isolation is shown. The red arrows indicate HMGB1-positive staining in the nucleus and -negative staining in the cytoplasm, and the yellow arrows point to loss of HMGB1 staining in the nucleus and appearance of a punctate pattern of positive staining in the cytoplasm. Western blot analysis for secreted HMGB1 in equal amounts of protein from the culture medium from HControl and HEtOH (C, bottom) and KCControl and KCEtOH (D, bottom) is shown. n = 3. ***, p < 0.001 for ethanol versus control. HMGB1 secretion in hepatocytes is oxidant stress-sensitive. Primary HControl were treated with 0–100 mm ethanol for 6 h or with 50 mm ethanol for 0–6 h. Western blot analysis shows that HControl respond to ethanol treatment in a dose- and time-dependent fashion (E). HControl treated with 25 μm H2O2 or with 30 μm arachidonic acid (AA) for 6 h increased HMGB1 expression and secretion as shown by immunofluorescence and Western blot analysis; however, the HMGB1 induction and secretion were prevented by co-treatment with 200 units/ml catalase or with 25 μm vitamin E, respectively (F). n = 3. *, p < 0.05; ***, p < 0.001 for treated versus control. •, p < 0.05; •••, p < 0.001 for co-treated versus control.
FIGURE 4.
FIGURE 4.
Primary hepatocytes and Kupffer cells from control and ethanol-fed mice retain their phenotype in vitro. Primary hepatocytes and Kupffer cells were isolated from mice fed the control or the ethanol Lieber-DeCarli diet for 7 weeks (HControl, HEtOH, KCControl, and KCEtOH) and cultured for up to 48 h. Bright field pictures along with pictures from hepatocytes fixed and stained with DAPI (blue) are shown (A, top). Transmission electron microscopy pictures from liver, hepatocytes, and Kupffer cells from control and ethanol-fed mice (the yellow arrows point to lipid droplets, and the pink arrows point to electron-dense mitochondria) are shown (A, middle). -Fold change of markers of injury in HControl and HEtOH is similar to what occurs in vivo (A, bottom). Bright field pictures from Kupffer cells (B, top) are shown. Cultured Kupffer cells were fixed and stained with DAPI and ED2 (orange arrow) or evaluated for phagocytic activity of fluorescent red nanoparticles (blue arrow) (B, bottom left). -Fold change in markers of injury in KCControl and KCEtOH is similar to what occurs in vivo (B, bottom right). n = 6. *, p < 0.05; **, p < 0.01; ***, p < 0.001 for ethanol versus control. HMGB1 induction, translocation, and secretion in hepatocytes are critical for alcohol-induced liver injury. Immunofluorescence analysis for HMGB1 expression in HControl and HEtOH (C, top) and KCControl and KCEtOH (D, top) at 6 and 24 h post-isolation is shown. The red arrows indicate HMGB1-positive staining in the nucleus and -negative staining in the cytoplasm, and the yellow arrows point to loss of HMGB1 staining in the nucleus and appearance of a punctate pattern of positive staining in the cytoplasm. Western blot analysis for secreted HMGB1 in equal amounts of protein from the culture medium from HControl and HEtOH (C, bottom) and KCControl and KCEtOH (D, bottom) is shown. n = 3. ***, p < 0.001 for ethanol versus control. HMGB1 secretion in hepatocytes is oxidant stress-sensitive. Primary HControl were treated with 0–100 mm ethanol for 6 h or with 50 mm ethanol for 0–6 h. Western blot analysis shows that HControl respond to ethanol treatment in a dose- and time-dependent fashion (E). HControl treated with 25 μm H2O2 or with 30 μm arachidonic acid (AA) for 6 h increased HMGB1 expression and secretion as shown by immunofluorescence and Western blot analysis; however, the HMGB1 induction and secretion were prevented by co-treatment with 200 units/ml catalase or with 25 μm vitamin E, respectively (F). n = 3. *, p < 0.05; ***, p < 0.001 for treated versus control. •, p < 0.05; •••, p < 0.001 for co-treated versus control.
FIGURE 5.
FIGURE 5.
Hmgb1fl/flAlb-Cre mice are protected from ALD. H&E staining from liver and kidney from non-treated Hmgb1fl/flAlb-Cre and Hmgb1fl/fl−/−Alb-Cre littermates is shown (A). HMGB1 IHC from liver and kidney from non-treated Hmgb1fl/flAlb-Cre mice and Hmgb1fl/fl−/−Alb-Cre mice is shown (B). The livers from Hmgb1fl/flAlb-Cre mice confirmed the absence of HMGB1-positive staining in hepatocytes compared with Hmgb1fl/fl−/−Alb-Cre mice (red arrow). Hmgb1fl/flAlb-Cre and Hmgb1fl/fl−/−Alb-Cre littermates were fed for 7 weeks the control or the ethanol Lieber-DeCarli diet. In IHC for HMGB1, the red arrow indicates HMGB1 positive staining in the nucleus and negative staining in the cytoplasm, and the yellow arrow points to HMGB1 negative staining in the nucleus and positive staining in the cytoplasm (C, top). Western blot analysis for HMGB1 in the ethanol-fed mice only is shown (C, bottom). Images show the gross appearance of the livers from control and ethanol-fed Hmgb1fl/flAlb-Cre and Hmgb1fl/fl−/−Alb-Cre mice (D, top). H&E staining shows steatosis (black arrow) and inflammation (orange arrow) (D, middle). Serum alanine aminotransferase (ALT) activity (units/liter), serum triglycerides (TG) (mg/dl), and liver triglycerides (mg/g of protein) along with the scores for steatosis, inflammation, and necrosis classified according to the Brunt scoring system (40) are shown (D, bottom). n = 10/group. *, p < 0.05; **p < 0.01 for ethanol versus control. •, p < 0.05; ••, p < 0.01 for Hmgb1fl/flAlb-Cre versus Hmgb1fl/fl−/−Alb-Cre. Hmgb1 ablation increases CPT1, pAMPKα, and pPPARα expression and enhances LDL plus VLDL export, preventing steatosis and liver injury in mice. Western blot analysis revealed an increase in the expression of CPT1, pAMPKα, and pPPARα in ethanol-fed Hmgb1fl/flAlb-Cre mice compared with Hmgb1fl/fl−/−Alb-Cre littermates (E). Serum and liver LDL plus VLDL levels in control and ethanol-fed Hmgb1fl/flAlb-Cre and Hmgb1fl/fl−/−Alb-Cre mice are shown (F). Results are expressed as average values ± S.E. n = 10/group. *, p < 0.05; **, p < 0.01 for ethanol versus control. •, p < 0.05; •••, p < 0.001 for Hmgb1fl/flAlb-Cre versus Hmgb1fl/fl−/−Alb-Cre. PV, portal vein; CV, central vein.
FIGURE 5.
FIGURE 5.
Hmgb1fl/flAlb-Cre mice are protected from ALD. H&E staining from liver and kidney from non-treated Hmgb1fl/flAlb-Cre and Hmgb1fl/fl−/−Alb-Cre littermates is shown (A). HMGB1 IHC from liver and kidney from non-treated Hmgb1fl/flAlb-Cre mice and Hmgb1fl/fl−/−Alb-Cre mice is shown (B). The livers from Hmgb1fl/flAlb-Cre mice confirmed the absence of HMGB1-positive staining in hepatocytes compared with Hmgb1fl/fl−/−Alb-Cre mice (red arrow). Hmgb1fl/flAlb-Cre and Hmgb1fl/fl−/−Alb-Cre littermates were fed for 7 weeks the control or the ethanol Lieber-DeCarli diet. In IHC for HMGB1, the red arrow indicates HMGB1 positive staining in the nucleus and negative staining in the cytoplasm, and the yellow arrow points to HMGB1 negative staining in the nucleus and positive staining in the cytoplasm (C, top). Western blot analysis for HMGB1 in the ethanol-fed mice only is shown (C, bottom). Images show the gross appearance of the livers from control and ethanol-fed Hmgb1fl/flAlb-Cre and Hmgb1fl/fl−/−Alb-Cre mice (D, top). H&E staining shows steatosis (black arrow) and inflammation (orange arrow) (D, middle). Serum alanine aminotransferase (ALT) activity (units/liter), serum triglycerides (TG) (mg/dl), and liver triglycerides (mg/g of protein) along with the scores for steatosis, inflammation, and necrosis classified according to the Brunt scoring system (40) are shown (D, bottom). n = 10/group. *, p < 0.05; **p < 0.01 for ethanol versus control. •, p < 0.05; ••, p < 0.01 for Hmgb1fl/flAlb-Cre versus Hmgb1fl/fl−/−Alb-Cre. Hmgb1 ablation increases CPT1, pAMPKα, and pPPARα expression and enhances LDL plus VLDL export, preventing steatosis and liver injury in mice. Western blot analysis revealed an increase in the expression of CPT1, pAMPKα, and pPPARα in ethanol-fed Hmgb1fl/flAlb-Cre mice compared with Hmgb1fl/fl−/−Alb-Cre littermates (E). Serum and liver LDL plus VLDL levels in control and ethanol-fed Hmgb1fl/flAlb-Cre and Hmgb1fl/fl−/−Alb-Cre mice are shown (F). Results are expressed as average values ± S.E. n = 10/group. *, p < 0.05; **, p < 0.01 for ethanol versus control. •, p < 0.05; •••, p < 0.001 for Hmgb1fl/flAlb-Cre versus Hmgb1fl/fl−/−Alb-Cre. PV, portal vein; CV, central vein.
FIGURE 6.
FIGURE 6.
Identification of HMGB1 PTMs in serum and liver from control and ethanol-fed mice. Representative spectra of whole protein ESI-MS of HMGB1 isoforms isolated from either serum (A) or liver (B) from control mice are shown. Peptide MS of HMGB1 derived from control mouse serum or liver was performed following enzymatic digestion with either Glu-C to confirm acetyl status (C) or trypsin to confirm redox status (D). Representative spectra of whole protein ESI-MS of HMGB1 isoforms isolated from either serum (E) or liver (F) from ethanol-fed mice are shown. Peptide MS of HMGB1 derived from serum or liver from ethanol-fed mice was performed following enzymatic digestion with endopeptidase Glu-C to confirm the lack of acetyl modifications on the 24,587 and 24,585-Da isoforms (G) and the presence of acetyl modifications on the 25,467-, 25,469-, and 25,549-Da isoforms (H). Molecular weights and a schematic representation of each isoform are indicated on each spectra where required. Acetyl modifications were confirmed on lysine residues (shown as K(Ac)) after LC-MS/MS analysis for peptides spanning NLS1 (amino acids 27–39) (I) and NLS2 (amino acids 180–188 (179–187 minus methionine)) (J) in HMGB1 derived from mice fed ethanol. Phosphorylation modifications were confirmed on serine 35 (shown as pS35) after LC-MS/MS analysis of NLS1 (K) in HMGB1 derived from mice fed ethanol. The one-letter amino acid code is given for each peptide sequence, and b and y ions are highlighted with molecular weights where appropriate. Data are representative of at least six individual mice per group.
FIGURE 6.
FIGURE 6.
Identification of HMGB1 PTMs in serum and liver from control and ethanol-fed mice. Representative spectra of whole protein ESI-MS of HMGB1 isoforms isolated from either serum (A) or liver (B) from control mice are shown. Peptide MS of HMGB1 derived from control mouse serum or liver was performed following enzymatic digestion with either Glu-C to confirm acetyl status (C) or trypsin to confirm redox status (D). Representative spectra of whole protein ESI-MS of HMGB1 isoforms isolated from either serum (E) or liver (F) from ethanol-fed mice are shown. Peptide MS of HMGB1 derived from serum or liver from ethanol-fed mice was performed following enzymatic digestion with endopeptidase Glu-C to confirm the lack of acetyl modifications on the 24,587 and 24,585-Da isoforms (G) and the presence of acetyl modifications on the 25,467-, 25,469-, and 25,549-Da isoforms (H). Molecular weights and a schematic representation of each isoform are indicated on each spectra where required. Acetyl modifications were confirmed on lysine residues (shown as K(Ac)) after LC-MS/MS analysis for peptides spanning NLS1 (amino acids 27–39) (I) and NLS2 (amino acids 180–188 (179–187 minus methionine)) (J) in HMGB1 derived from mice fed ethanol. Phosphorylation modifications were confirmed on serine 35 (shown as pS35) after LC-MS/MS analysis of NLS1 (K) in HMGB1 derived from mice fed ethanol. The one-letter amino acid code is given for each peptide sequence, and b and y ions are highlighted with molecular weights where appropriate. Data are representative of at least six individual mice per group.
FIGURE 7.
FIGURE 7.
LC-MS and LC-MS/MS redox characterization of HMGB1 isoforms in ethanol-fed mice. Representative spectra of the LC-MS characterization of peptides produced from HMGB1 from the serum of ethanol-fed mice enzymatically cleaved with trypsin (A) are shown. Representative spectra of the LC-MS/MS of peptides derived from the tryptic digestion of HMGB1 isoforms derived from the serum of ethanol-fed mice covering cysteine residues 23 (B), 45 (C), and 106 (D), which had been subjected to alkylation by either N-ethylmaleimide or iodoacetamide, are also shown. The one-letter amino acid code is given for each peptide sequence, and b and y ions are labeled with molecular weights and amino acid code where appropriate. Data are representative of at least six individual ethanol-fed mice.
FIGURE 8.
FIGURE 8.
Whole protein ESI-MS and LC-MS/MS characterization of HMGB1 isoforms in healthy volunteers and in patients with ALD. Representative spectra of whole protein ESI-MS of HMGB1 isoforms isolated from serum of healthy volunteers (A) or patients with ALD (B) are shown. Molecular weights and a schematic representation of each isoform are indicated on each spectra where required. Representative spectra of the tandem MS characterization of a peptide containing lysine residues (Lys-28, -29, and -30) within NLS1 (C) and lysine residues (Lys-180, -182, -183, -184, and -185) within NLS2 (D) after Glu-C digestion of the 25,467- and 25,549-Da human HMGB1 isoforms following extraction from the serum of ALD patients are shown. HMGB1 was enzymatically cleaved with endopeptidase Glu-C to confirm the presence or absence of acetyl modifications on specific lysine residues (shown as K(Ac)) as described under “Experimental Procedures.” The one-letter amino acid code is given for each peptide sequence, and b and y ions are labeled with molecular weights and amino acid code where appropriate. Data are representative of either 10 healthy volunteers or 10 ALD patients.

References

    1. Bonaldi T., Talamo F., Scaffidi P., Ferrera D., Porto A., Bachi A., Rubartelli A., Agresti A., Bianchi M. E. (2003) Monocytic cells hyperacetylate chromatin protein HMGB1 to redirect it towards secretion. EMBO J. 22, 5551–5560 - PMC - PubMed
    1. Taira J., Kida Y., Kuwano K., Higashimoto Y. (2013) Protein phosphatase 2A dephosphorylates phosphoserines in nucleocytoplasmic shuttling and secretion of high mobility group box 1. J. Biochem. 154, 299–308 - PubMed
    1. Carneiro V. C., de Moraes Maciel R., de Abreu da Silva I. C., da Costa R. F., Paiva C. N., Bozza M. T., Fantappié M. R. (2009) The extracellular release of Schistosoma mansoni HMGB1 nuclear protein is mediated by acetylation. Biochem. Biophys. Res. Commun. 390, 1245–1249 - PubMed
    1. Liu S., Stolz D. B., Sappington P. L., Macias C. A., Killeen M. E., Tenhunen J. J., Delude R. L., Fink M. P. (2006) HMGB1 is secreted by immunostimulated enterocytes and contributes to cytomix-induced hyperpermeability of Caco-2 monolayers. Am. J. Physiol. Cell Physiol. 290, C990–C999 - PubMed
    1. Soop A., Hållström L., Frostell C., Wallén H., Mobarrez F., Pisetsky D. S. (2013) Effect of lipopolysaccharide administration on the number, phenotype and content of nuclear molecules in blood microparticles of normal human subjects. Scand. J. Immunol. 78, 205–213 - PubMed

Publication types

MeSH terms