. 2014 Aug 8;289(32):21937-49.
doi: 10.1074/jbc.M113.544957. Epub 2014 Jun 13.

Uric acid and thiocyanate as competing substrates of lactoperoxidase

Affiliations

Uric acid and thiocyanate as competing substrates of lactoperoxidase

Antonia Seidel et al. J Biol Chem. .

Abstract

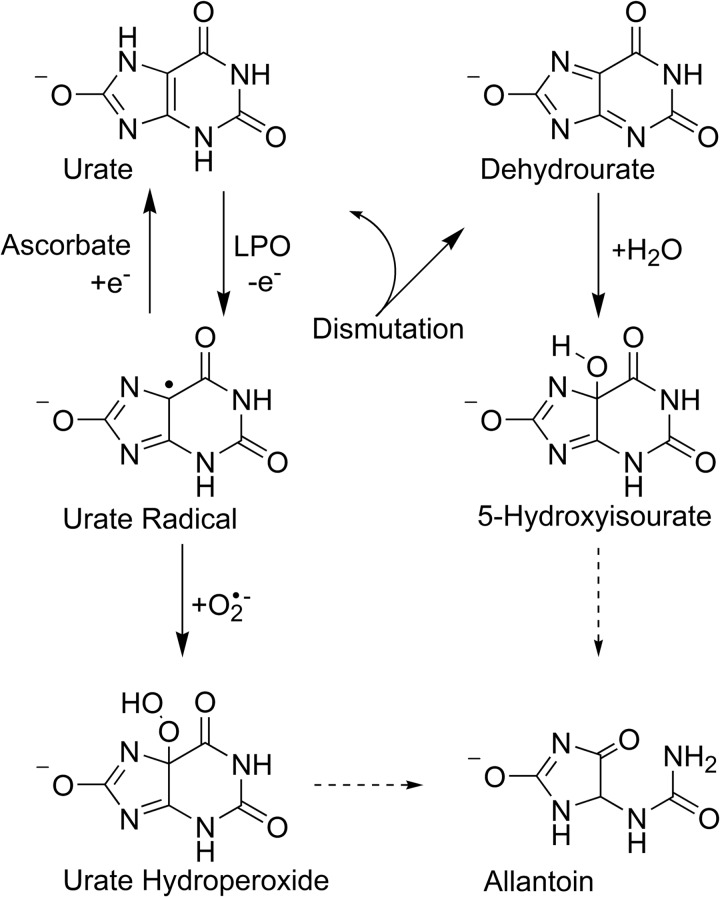
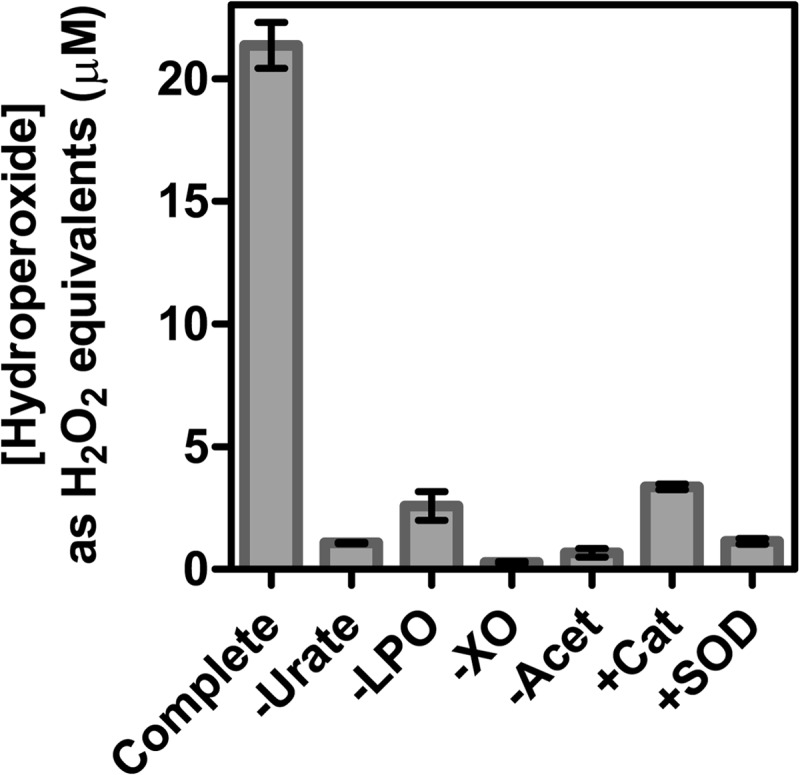
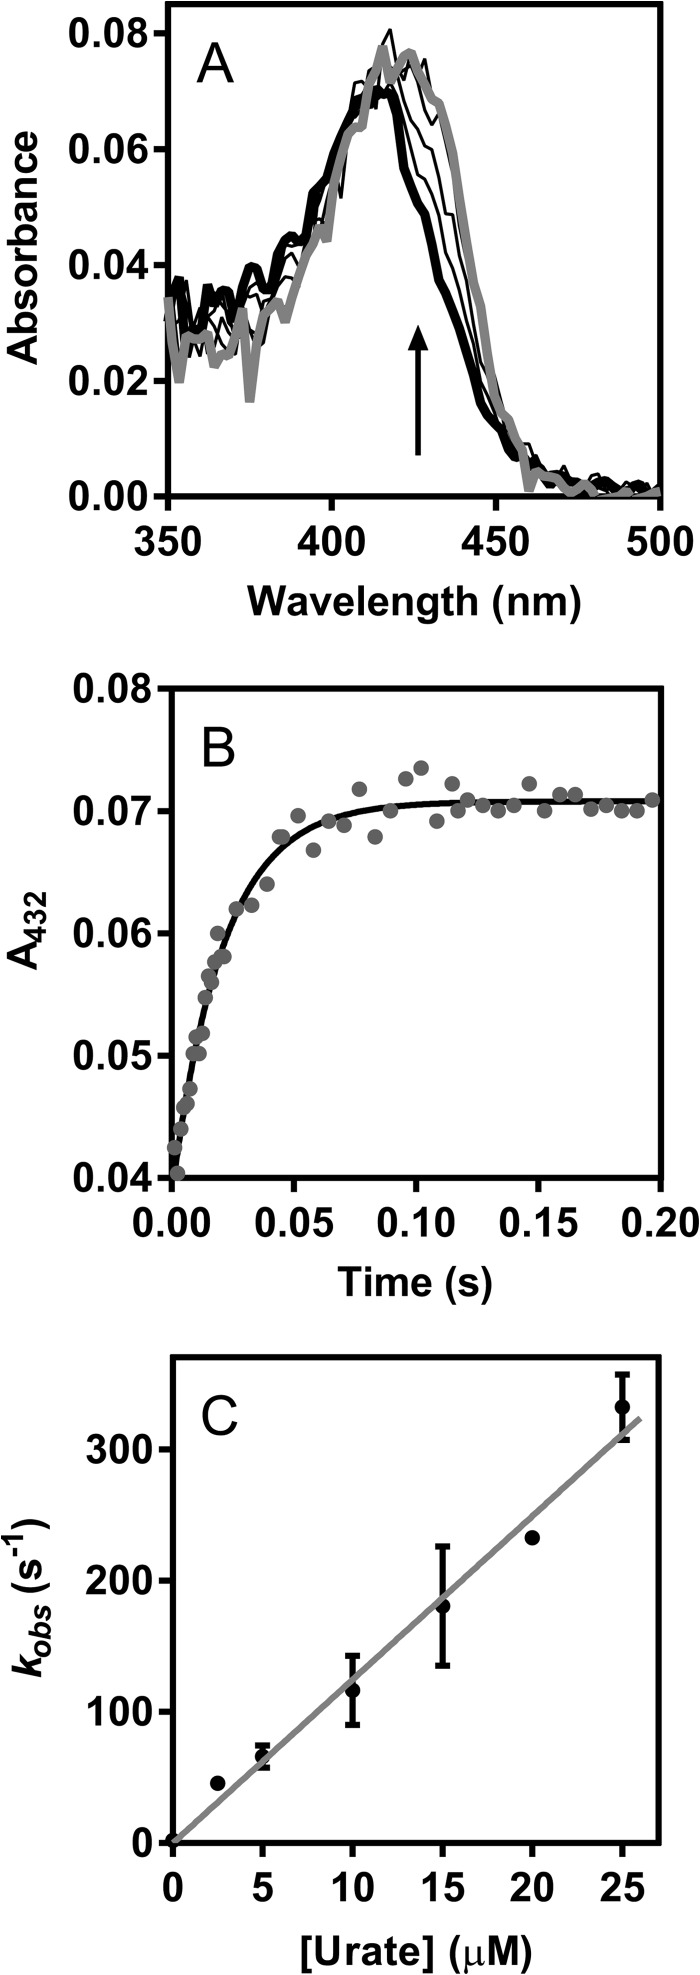
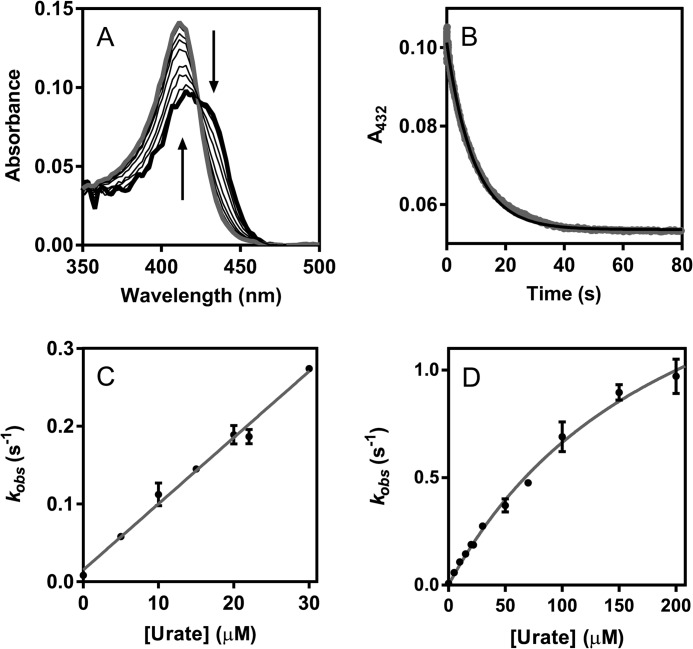
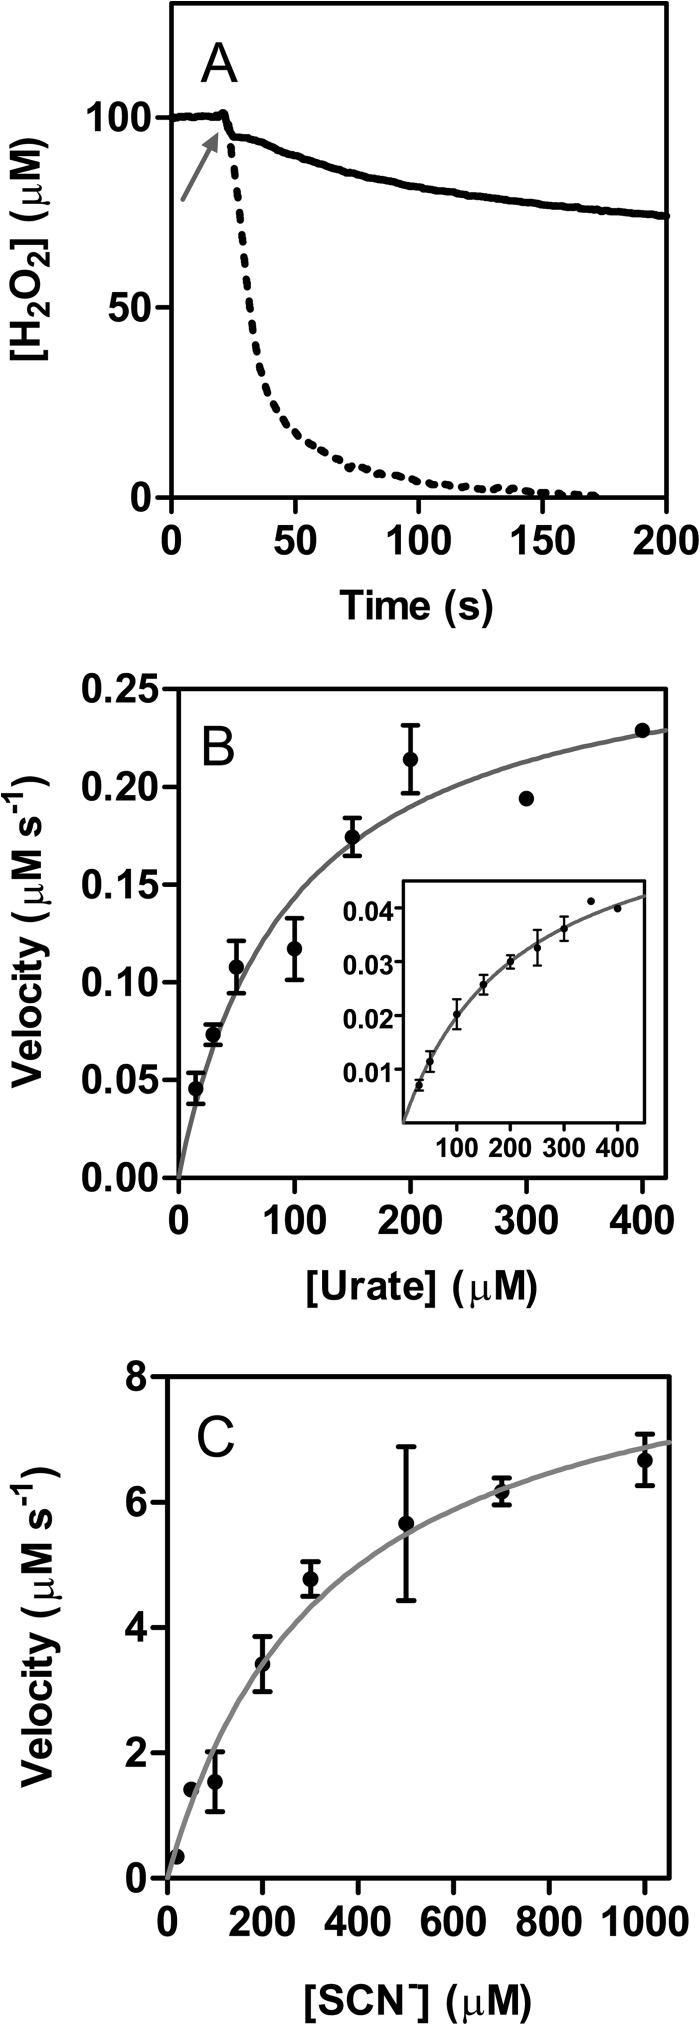
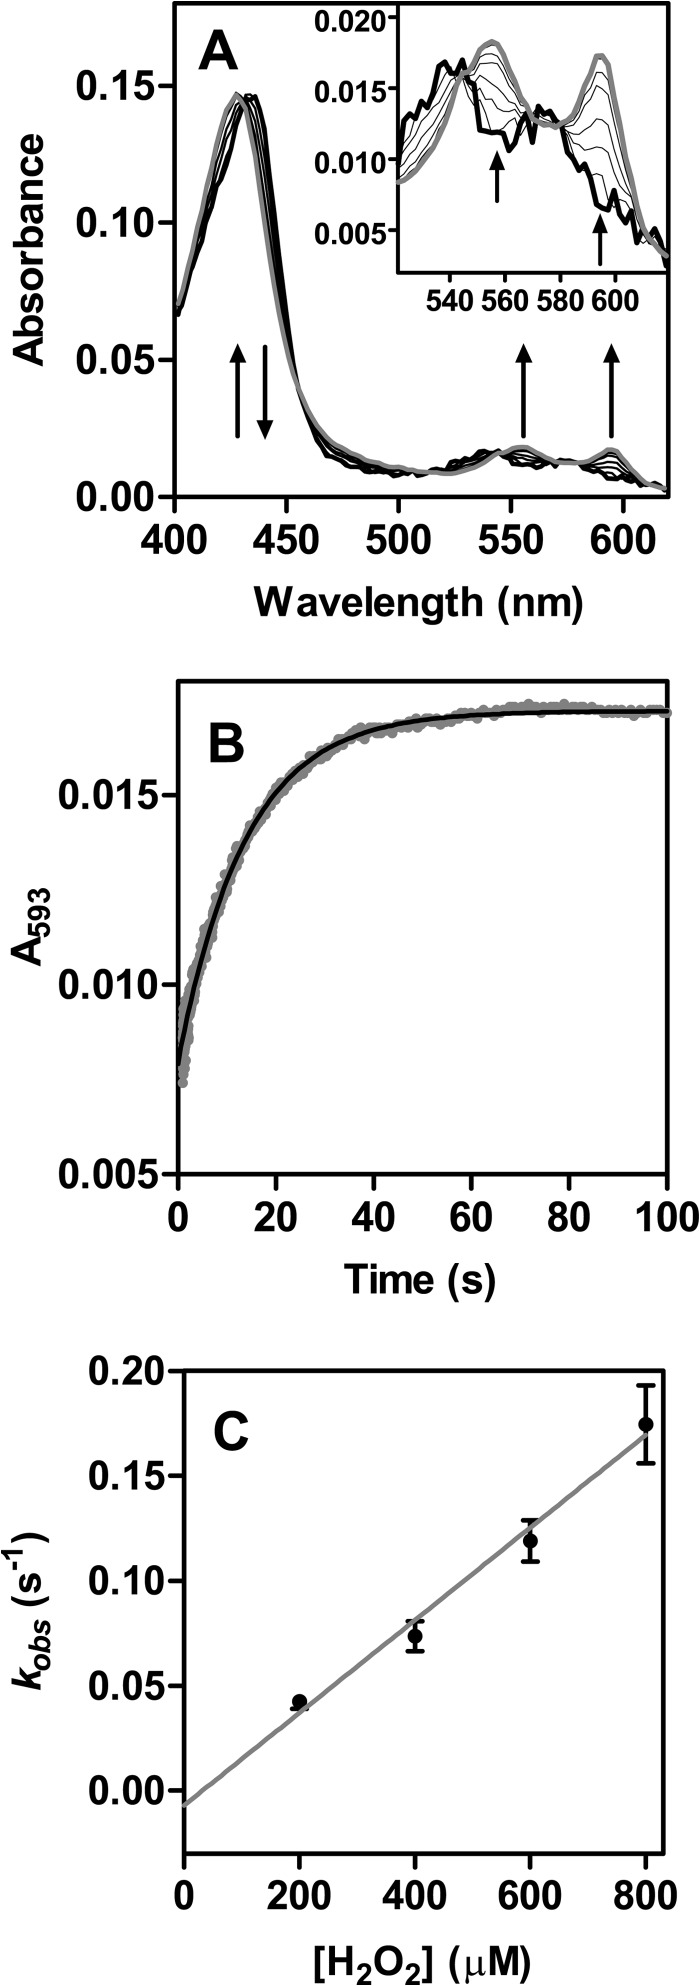
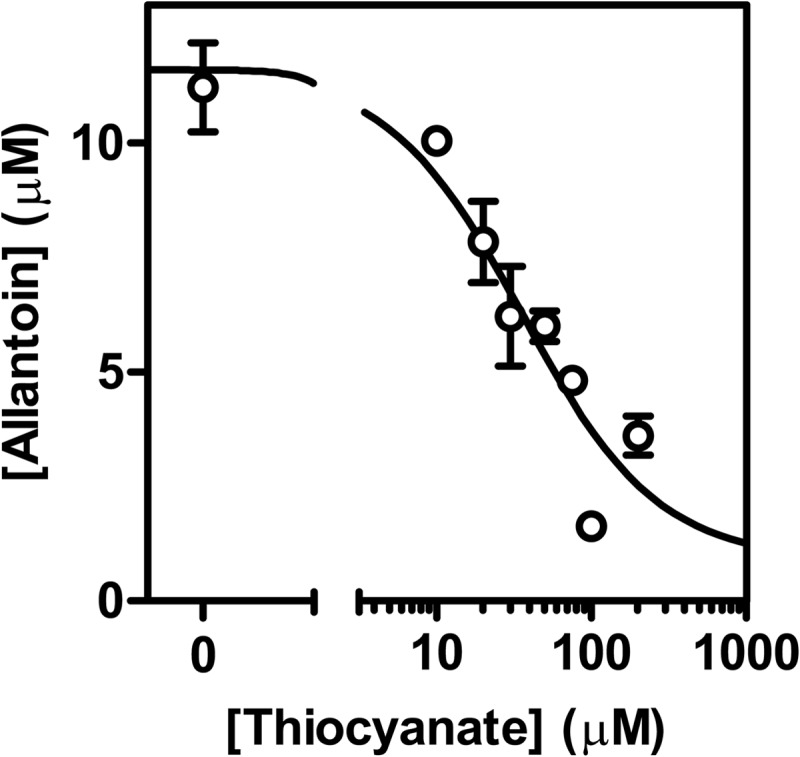
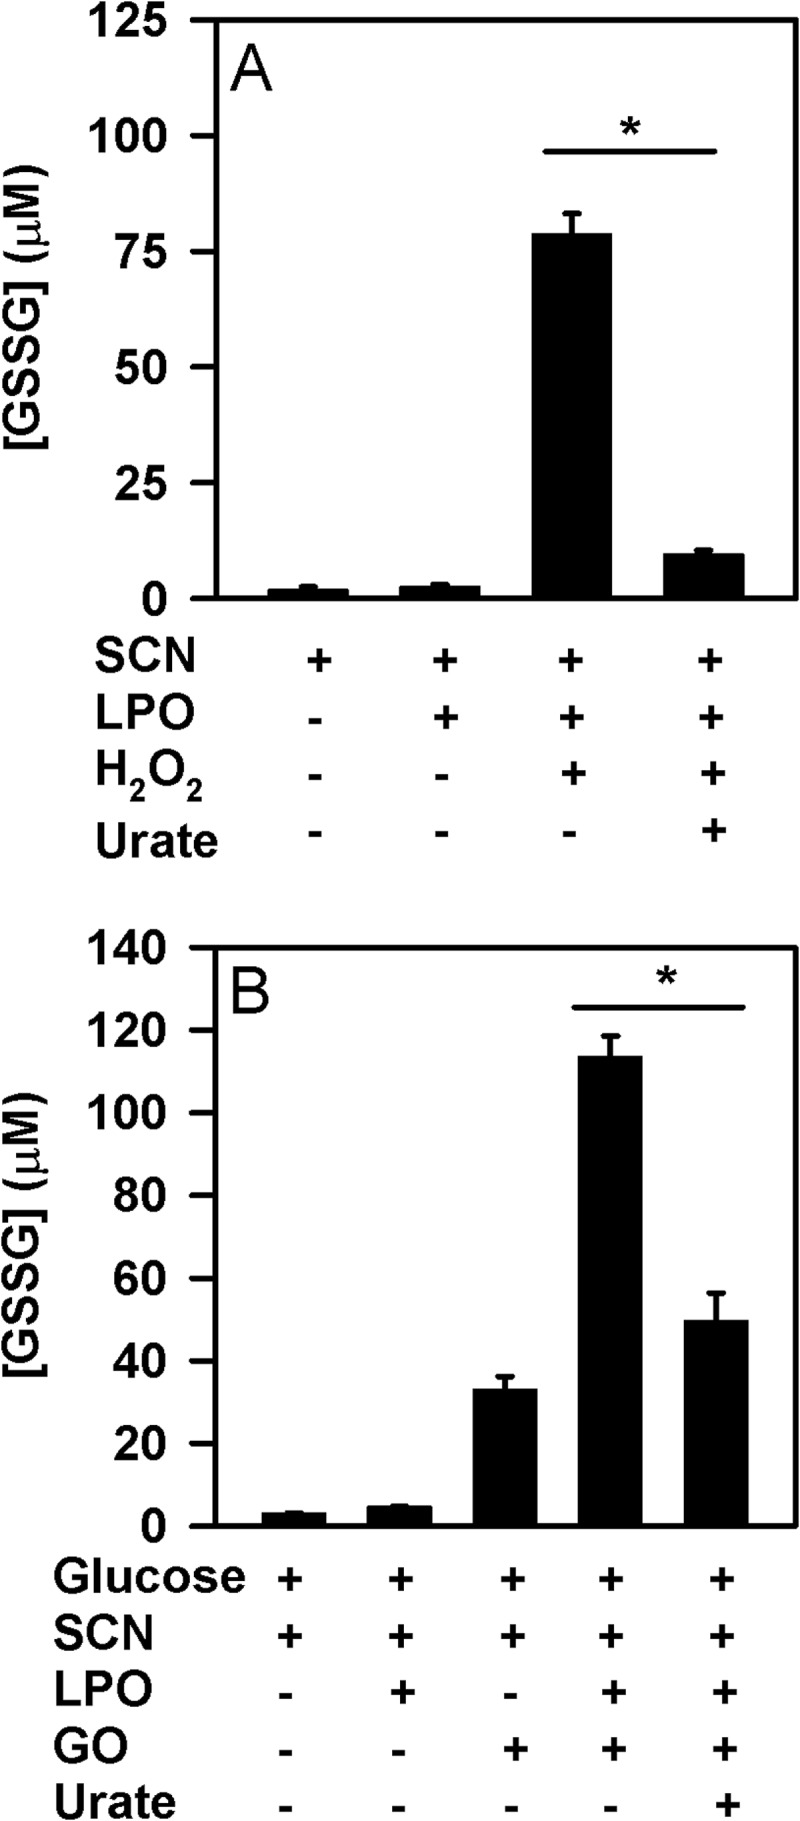
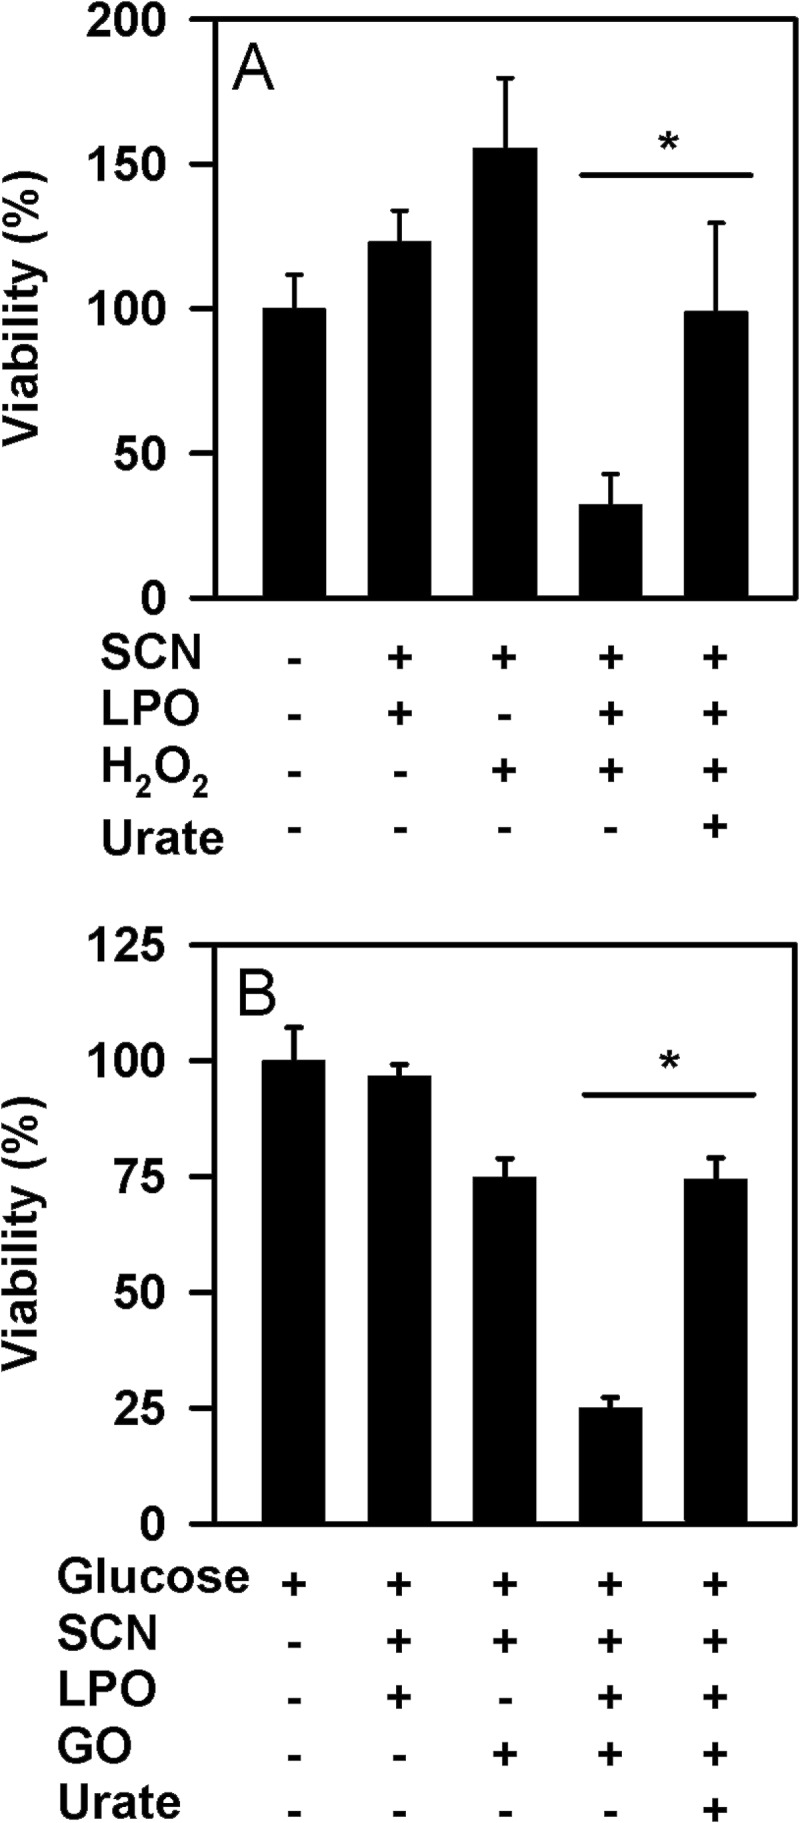
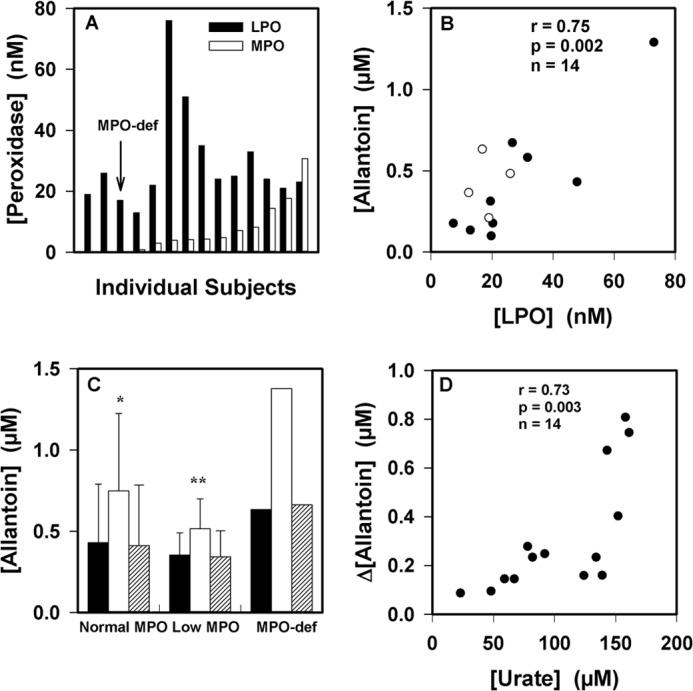
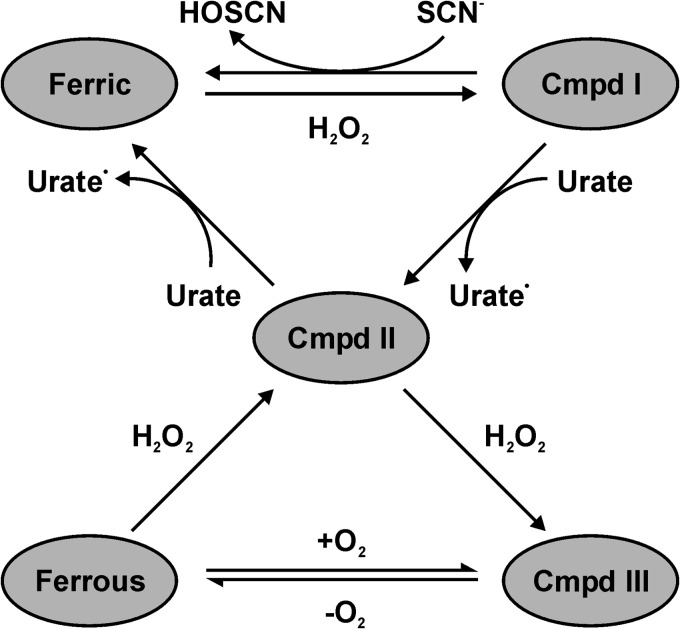
The physiological function of urate is poorly understood. It may act as a danger signal, an antioxidant, or a substrate for heme peroxidases. Whether it reacts sufficiently rapidly with lactoperoxidase (LPO) to act as a physiological substrate remains unknown. LPO is a mammalian peroxidase that plays a key role in the innate immune defense by oxidizing thiocyanate to the bactericidal and fungicidal agent hypothiocyanite. We now demonstrate that urate is a good substrate for bovine LPO. Urate was oxidized by LPO to produce the electrophilic intermediates dehydrourate and 5-hydroxyisourate, which decayed to allantoin. In the presence of superoxide, high yields of hydroperoxides were formed by LPO and urate. Using stopped-flow spectroscopy, we determined rate constants for the reaction of urate with compound I (k1 = 1.1 × 10(7) M(-1) s(-1)) and compound II (k2 = 8.5 × 10(3) M(-1) s(-1)). During urate oxidation, LPO was diverted from its peroxidase cycle because hydrogen peroxide reacted with compound II to give compound III. At physiologically relevant concentrations, urate competed effectively with thiocyanate, the main substrate of LPO for oxidation, and inhibited production of hypothiocyanite. Similarly, hypothiocyanite-dependent killing of Pseudomonas aeruginosa was inhibited by urate. Allantoin was present in human saliva and associated with the concentration of LPO. When hydrogen peroxide was added to saliva, oxidation of urate was dependent on its concentration and peroxidase activity. Our findings establish urate as a likely physiological substrate for LPO that will influence host defense and give rise to reactive electrophilic metabolites.

Keywords: Host Defense; Kinetics; Peroxidase; Pre-steady-state Kinetics; Uric Acid.


Figures

FIGURE 1.
FIGURE 1.
Potential reaction pathways for urate radicals that are formed when urate is oxidized by LPO. Dehydrourate, 5-hydroxyisourate, and allantoin were detected directly by mass spectrometry. The structure of urate hydroperoxide is a proposal only. Straight arrows represent direct reactions, and dashed arrows represent breakdown pathways.
FIGURE 2.
FIGURE 2.
Formation of hydroperoxides during oxidation of urate by LPO in the presence of superoxide. For the complete system, urate (200 μm) was incubated with LPO (150 nm) and xanthine oxidase (XO, 200 nm) in 50 mm phosphate buffer, pH 7.4. Reactions were started by the addition of acetaldehyde (Acet, 3 mm) to produce a superoxide flux of 6 μm/min and stopped after 30 min by adding catalase (100 μg/ml). Hydroperoxides were quantified by the FOX assay and were expressed as hydrogen peroxide equivalents. When added to the reaction system, catalase (Cat) and superoxide dismutase (SOD) were present at 100 and 20 μg/ml, respectively. Data are means and ranges of at least duplicate experiments.
FIGURE 3.
FIGURE 3.
Determination of the rate constant for the reaction of LPO compound I with urate. LPO (1 μm) was premixed with hydrogen peroxide (1 μm) to form compound I at 25 °C in 50 mm phosphate buffer, pH 7.0. After a delay time of 100 ms, urate was added (0–25 μm). All solutions were prepared freshly and kept in the dark to avoid photolysis. A, spectral changes after the addition of urate (2.5 μm) followed between 3 ms (thick black line) and 200 ms (gray line); only representative spectra are shown. B, formation of compound II in A was monitored at 432 nm (gray dots), and the data were fitted by single exponential functions (black line). C, the averaged observed rate constants kobs were plotted against the concentration of urate (black dots). Data are means and standard deviations of at least triplicate measurements. The slope of the linear fit corresponds to the second-order rate constant of the reaction of LPO compound I with urate.
FIGURE 4.
FIGURE 4.
Determination of the rate constant for the reaction of LPO compound II with urate. LPO (1 μm) was premixed with hydrogen peroxide (1 μm) to form compound I at 25 °C in 50 mm phosphate buffer, pH 7.0. After a delay time of 100 ms or 2 s, urate was added (0–200 μm). A, spectral changes after the addition of urate (10 μm) followed between 1 ms (thick black line) and 80 s (gray line); only representative spectra are shown (2-s delay time). B, reduction of compound II in A was monitored at 432 nm (gray dots), and the data were fitted to a single exponential function (black line). C, the averaged observed rate constants kobs were plotted against the concentration of urate (black dots). Data are means and ranges of at least duplicate measurements. The slope of the linear fit corresponds to the second-order rate constant of the reaction of LPO compound II with urate. D, the plot of averaged observed rate constants versus urate concentration levels off at high urate concentration. Data are means and ranges of duplicate experiments (black dots) and were fitted to a rectangular hyperbola (gray line) using Equation 1.
FIGURE 5.
FIGURE 5.
Steady state oxidation of urate and thiocyanate by LPO. A, loss of hydrogen peroxide during thiocyanate (dotted line) and urate (solid line) oxidation by LPO measured continuously using a hydrogen peroxide specific electrode. Reaction mixtures contained 100 μm hydrogen peroxide, 50 nm LPO, and 1 mm thiocyanate or 100 μm hydrogen peroxide, 500 nm LPO, and 300 μm urate, respectively, in 50 mm phosphate buffer, pH 7.0, at 25 °C. Arrow indicates when LPO was added. B, initial phase of urate degradation was monitored at 291 nm except at high urate concentrations (>200 μm), when it was followed by recording hydrogen peroxide depletion. Inset shows data obtained for the secondary phase. Reaction mixtures contained 500 nm LPO, 100 μm hydrogen peroxide, and 30–400 μm urate. The velocities were plotted against substrate concentration (black dots) and were fitted to the Michaelis-Menten equation (gray lines). C, oxidation of thiocyanate by LPO was monitored by measuring the loss of hydrogen peroxide. Reaction mixtures contained 50 nm LPO, 100 μm hydrogen peroxide, and 20–1000 μm thiocyanate. The velocities were verified by following the oxidation of TNB by hypothiocyanite at 412 nm. These experiments were performed under the same reaction conditions with 100 μm TNB added to the reaction mixture. Data are means and standard deviations of at least triplicate experiments.
FIGURE 6.
FIGURE 6.
Determination of the rate constant for the reaction of LPO compound II with hydrogen peroxide to form compound III. LPO (2 μm) was preincubated with urate (400 μm) and then allowed to react with various concentrations of hydrogen peroxide (200–800 μm) at 25 °C in 50 mm phosphate buffer, pH 7.0. A, representative spectral changes followed between 5 ms (thick black line) and 80 s (gray line) using 200 μm H2O2. Inset shows the α and β bands in greater detail. B, the formation of compound III was monitored at 593 nm (gray dots), and the data were fitted by single exponential functions (black line); representative data were obtained using 200 μm H2O2. C, the averaged observed rate constants kobs were plotted against the concentration of hydrogen peroxide (black dots). Data are means and standard deviations of triplicate measurements. The slope of the linear fit corresponds to the second-order rate constant of the reaction of LPO compound II with hydrogen peroxide to form compound III.
FIGURE 7.
FIGURE 7.
Thiocyanate and urate compete as substrates for LPO. LPO (50 nm) was incubated with urate (400 μm) and various concentrations of thiocyanate (0–200 μm) in 50 mm phosphate buffer, pH 7.4. Reactions were started by the addition of hydrogen peroxide (20 μm) and stopped by the addition of 20 μg/ml catalase. Allantoin formation was measured by LC/MS. The concentration of thiocyanate, when allantoin formation is inhibited by 50% (IC50), was determined by fitting the data as described under “Experimental Procedures” (solid line). Data are means and ranges of duplicate experiments.
FIGURE 8.
FIGURE 8.
Effect of urate on LPO-mediated production of hypothiocyanite. The formation of hypothiocyanite by LPO was measured as oxidation of GSH to GSSG. A, hypothiocyanite was generated by the addition of 50 μm H2O2 to 10 nm LPO and 100 μm thiocyanate in the presence or absence of 250 μm urate in 10 mm phosphate buffer, pH 6.8. After a 10-min incubation at room temperature, 10 μg/ml catalase was added followed by N-ethylmaleimide. Data are means and standard deviations of five individual experiments. B, hypothiocyanite was produced over 1 h at 37 °C by incubation of 2 μg/ml glucose oxidase (GO) with 10 nm LPO, 100 μm thiocyanate, and 200 μm GSH in the presence or absence of 250 μm urate in 10 mm phosphate buffer, pH 6.8. Reactions were stopped by adding catalase (20 μg/ml), and then unreacted GSH was alkylated with 4 mm N-ethylmaleimide. Data are means and standard deviations for a representative experiment of 3–4 separate experiments. Data were analyzed by ANOVA using Holm-S̊ídák post hoc analysis. *, p < 0.05 for comparisons versus the complete reaction system.
FIGURE 9.
FIGURE 9.
Effect of urate on killing of P. aeruginosa by LPO. A, hypothiocyanite was generated by the addition of 50 μm hydrogen peroxide to 10 nm LPO and 100 μm thiocyanate in the presence or absence of 250 μm urate in 10 mm phosphate buffer, pH 6.8. After a 10-min incubation at room temperature, catalase (10 μg/ml) was added to remove residual hydrogen peroxide. Bacteria (1 × 10⁵/ml) were then added and incubated for 2 h at 37 °C with gentle rotation. B, P. aeruginosa were incubated for 1 h (37 °C, 6 rpm) with 2 μg/ml glucose oxidase, 10 nm LPO, and 100 μm thiocyanate in the presence or absence of 250 μm urate in 10 mm phosphate buffer, pH 6.8, containing 1 mg/ml glucose. This system generated ∼1.5 μm hydrogen peroxide/min. Catalase (10 μg/ml) was added prior to dilution and plating. Data are means and standard errors of 3–4 separate experiments. Data were analyzed by ANOVA using Holm-S̊ídák post hoc analysis. *, p < 0.05 for comparisons versus the complete reaction system.
FIGURE 10.
FIGURE 10.
Urate oxidation by peroxidases in human saliva. A, LPO and MPO activities were measured in diluted saliva supernatants from 14 healthy donors. B, the allantoin concentration in saliva supernatants was related to the concentration of LPO. Clear circles are for the individuals with low or no MPO activity. The association between parameters was determined using Pearson's correlation. C, allantoin formation was measured in saliva supernatants after incubation for 30 min at 37 °C with no additions (black bars), with added hydrogen peroxide (50 μm, white bars), and with added hydrogen peroxide and azide (1 mm, respectively, striped bars). Reactions were stopped by the addition of catalase (10 μg/ml). Significant differences (p < 0.05) from the control with no added hydrogen peroxide were determined using repeated measures ANOVA. Data are means and ranges of at least duplicate experiments. MPO-def, MPO-deficient. D, initial urate concentrations in saliva supernatants were compared with the increase in allantoin concentration formed by the addition of hydrogen peroxide (50 μm) as in C. The association between parameters was determined using Pearson's correlation.
FIGURE 11.
FIGURE 11.
Suggested catalytic mechanism of LPO in an environment where similar concentrations of thiocyanate and urate are present. At low concentrations of hydrogen peroxide, urate will compete with thiocyanate for reaction with compound I (Cmpd I). Which substrate dominates will depend on their relative local concentrations. Urate will also ensure that LPO is not trapped at compound II (Cmpd II), thereby ensuring continual oxidant production by the enzyme. At high concentrations of hydrogen peroxide, LPO will be converted compound III (Cmpd III), whereas its conversion back to compound II relies on its slow release of oxygen (55). Under these conditions, the bactericidal activity of LPO will be inhibited.

Similar articles

Cited by

References

    1. Becker B. F. (1993) Towards the physiological function of uric acid. Free Radic. Biol. Med. 14, 615–631 - PubMed
    1. Frei B., Stocker R., Ames B. N. (1988) Antioxidant defenses and lipid peroxidation in human blood plasma. Proc. Natl. Acad. Sci. U.S.A. 85, 9748–9752 - PMC - PubMed
    1. Wayner D. D. M., Burton G. W., Ingold K. U., Barclay L. R. C., Locke S. J. (1987) The relative contributions of vitamin E, urate, ascorbate and proteins to the total peroxyl radical-trapping antioxidant activity of human blood plasma. Biochim. Biophys. Acta 924, 408–419 - PubMed
    1. Uotila J., Metsa-Ketela T., Tuimala R. (1992) Plasma peroxyl radical-trapping capacity in severe preeclampsia is strongly related to uric acid. Clin. Exp. Hypertens. B b11, 71–80
    1. Peden D. B., Hohman R., Brown M. E., Mason R. T., Berkebile C., Fales H. M., Kaliner M. A. (1990) Uric acid is a major antioxidant in human nasal airway secretions. Proc. Natl. Acad. Sci. U.S.A. 87, 7638–7642 - PMC - PubMed

Publication types

LinkOut - more resources