. 2014 Jun 24;111(25):9235-40.
doi: 10.1073/pnas.1404303111. Epub 2014 Jun 13.

Chem-seq permits identification of genomic targets of drugs against androgen receptor regulation selected by functional phenotypic screens

Affiliations

Chem-seq permits identification of genomic targets of drugs against androgen receptor regulation selected by functional phenotypic screens

Chunyu Jin et al. Proc Natl Acad Sci U S A. .

Abstract

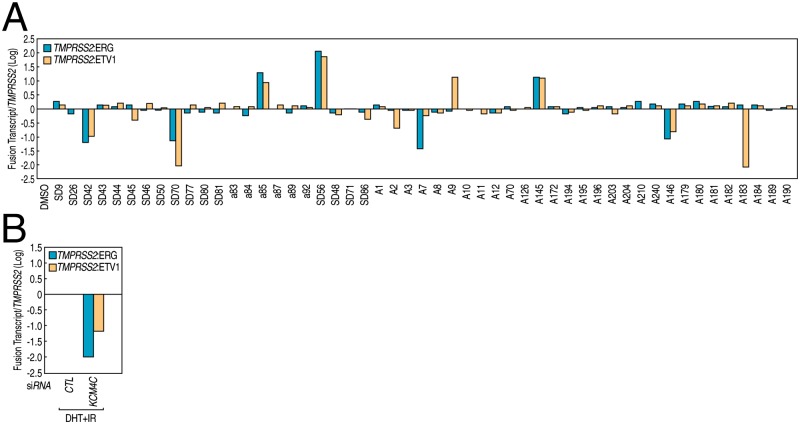
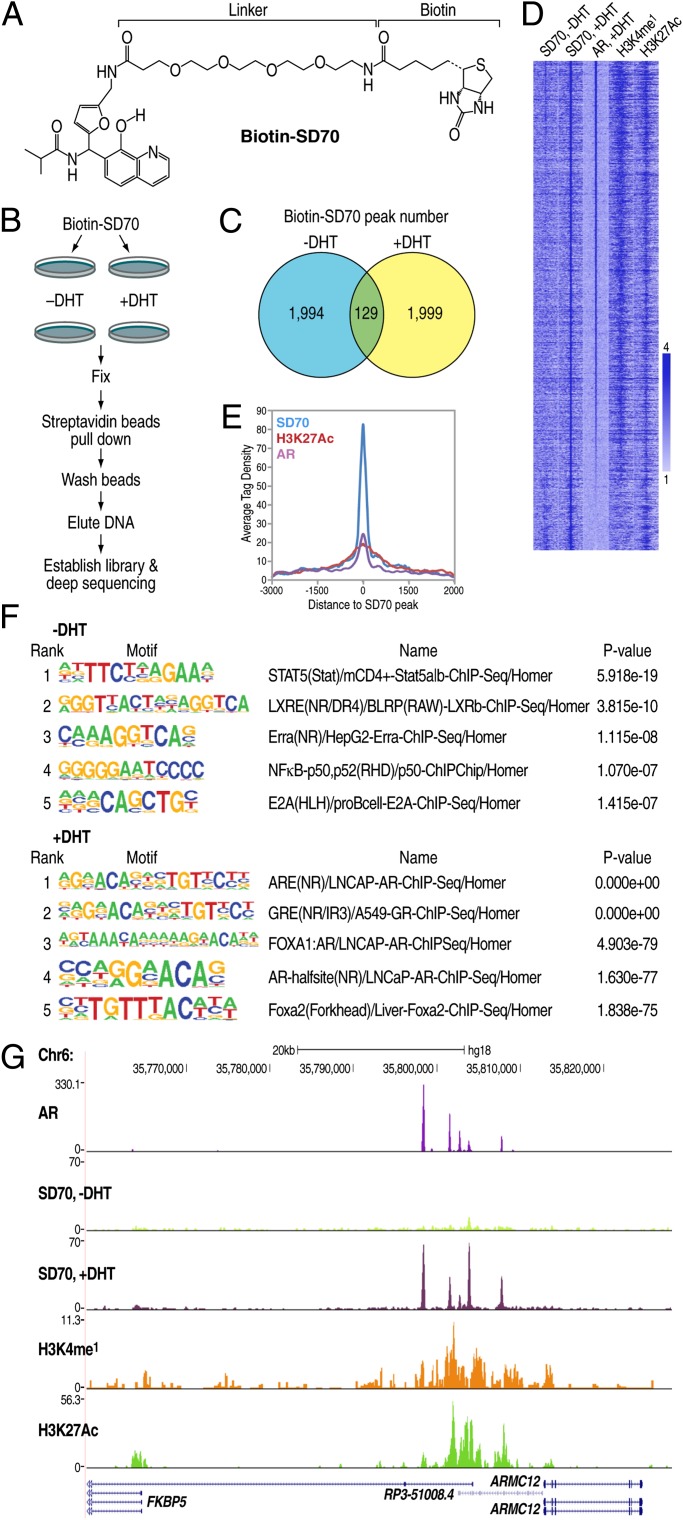
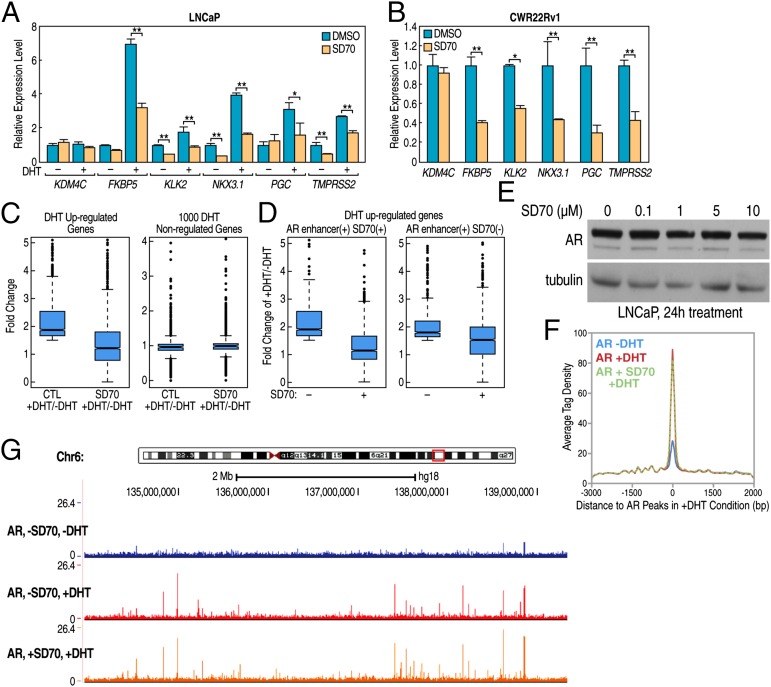
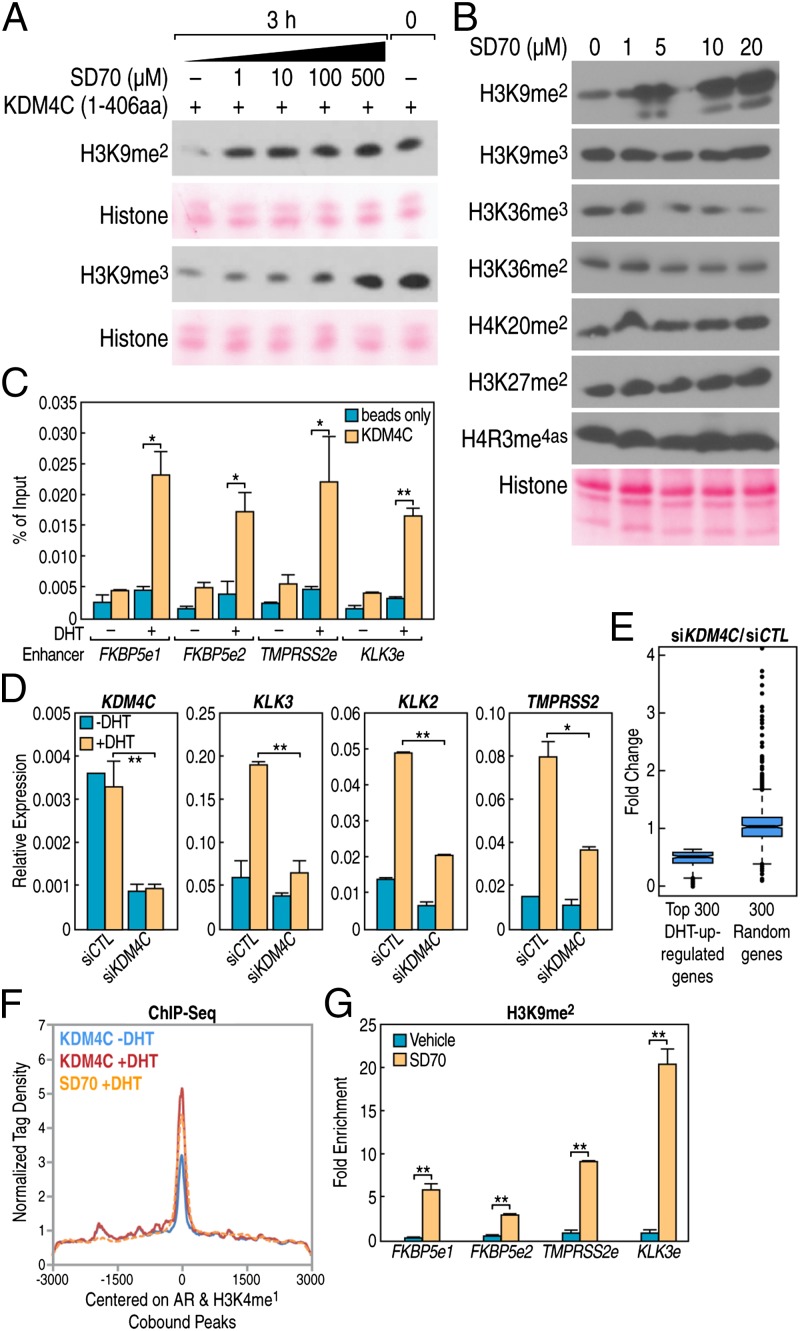
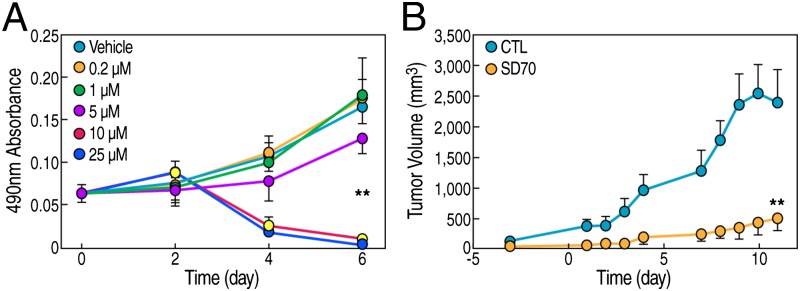
Understanding the mechanisms by which compounds discovered using cell-based phenotypic screening strategies might exert their effects would be highly augmented by new approaches exploring their potential interactions with the genome. For example, altered androgen receptor (AR) transcriptional programs, including castration resistance and subsequent chromosomal translocations, play key roles in prostate cancer pathological progression, making the quest for identification of new therapeutic agents and an understanding of their actions a continued priority. Here we report an approach that has permitted us to uncover the sites and mechanisms of action of a drug, referred to as "SD70," initially identified by phenotypic screening for inhibitors of ligand and genotoxic stress-induced translocations in prostate cancer cells. Based on synthesis of a derivatized form of SD70 that permits its application for a ChIP-sequencing-like approach, referred to as "Chem-seq," we were next able to efficiently map the genome-wide binding locations of this small molecule, revealing that it largely colocalized with AR on regulatory enhancers. Based on these observations, we performed the appropriate global analyses to ascertain that SD70 inhibits the androgen-dependent AR program, and prostate cancer cell growth, acting, at least in part, by functionally inhibiting the Jumonji domain-containing demethylase, KDM4C. Global location of candidate drugs represents a powerful strategy for new drug development by mapping genome-wide location of small molecules, a powerful adjunct to contemporary drug development strategies.

Keywords: histone demethylase; transcription.


Conflict of interest statement

The authors declare no conflict of interest.

Figures

Fig. 1.
Fig. 1.
Chromosomal translocation chemical library screens identified SD70 as a translocation inhibitor. (A) RT-qPCR analysis of fusion genes TMPRSS2:ERG and TMPRSS2:ETV1 in LNCaP cells pretreated with compounds as indicated for 2 h followed by DHT (100 nM) and irradiation (50 Gy) for 24 h. (B) RT-qPCR analysis of fusion genes TMPRSS2:ERG and TMPRSS2:ETV1 in LNCaP cells treated with DHT (100 nM) and irradiation (50 Gy) for 24 h in the presence of validated siRNAs as indicated.
Fig. 2.
Fig. 2.
Chem-seq revealed colocalization of SD70 and AR enhancer genomic binding sites. (A) Structure of Biotin-SD70. (B) Flowchart of SD70 Chem-seq procedure. (C) HOMER peak number of SD70 Chem-seq in the basal or DHT treatment condition. Detailed parameters are described in SI Methods. (D) Heatmap showing the distribution of Biotin-SD70, AR (GSM699631, +DHT), and the two enhancer marker [H3K4me1 (GSM686928) and H3K27Ac (GSM686937)] binding sites (−3kb/+3kb relative to the center of 1999 DHT induced Biotin-SD70 peak LNCaP cells). Each horizontal bar represents a single Biotin-SD70 binding site, and the color scale indicates the normalized tag density in 100-nt bins. Scale: lower limit = 0; midpoint value = 1; higher limit = 4. (E) Average tag profile analysis of the aligned 2,128 SD70 peaks showing focal SD70 binding in association with AR occupancy and H3K27Ac. (F) Motif enrichment of SD70 binding sites in the absence or presence of DHT condition. (G) UCSC genome browser shot for SD70 occupancy at the enhancer of AR target gene FKBP5, as an example, overlaying regions of AR occupancy.
Fig. 3.
Fig. 3.
SD70 inhibits AR target gene expression. (A) RT-qPCR analysis of KDM4C and some canonical AR target gene expression level in LNCaP cells treated with SD70 (10 μM) or vehicle (0.1% DMSO) for 2 h followed by DHT (100 nM) treatment for 4 h. Error bars represent SD for three repeats (*P < 0.05 and **P < 0.01). (B) RT-qPCR analysis of KDM4C and some canonical AR target gene expression level in CWR22Rv1 cells treated with SD70 (10 μM) or vehicle (0.1% DMSO) for 2 h. Error bars represent SD for three repeats (*P < 0.05 and **P < 0.01). (C) Global DHT induced expression FCs for DHT up-regulated genes (n = 2,445, FC >1.5) in SD70 (10 μM) pretreated for 2 h versus vehicle before DHT (100 nM)-treated or nontreated LNCaP cells, determined by GRO-Seq. (C, Left) DHT induction effect was significantly reduced with treatment of SD70 (P < 10−5). (C, Right) One thousand randomly chosen DHT nonregulated genes exhibiting no changes upon SD70 treatment as a negative control. (D) Global DHT induction changes in DHT-induced AR target genes by SD70 treatment. SD70 depletes the DHT induction effect on the cohort of genes with SD70 binding sites (Left, median = 1.914 for non-SD70 treatment and 1.138 for SD70 treatment, n = 1,132, FC > 1.5, AR binding sites within 500 kb from the TSS, P = 1.23 × 10−90) with minimal (Right, median = 1.774 for non-SD70 treatment and 1.510 for SD70 treatment, n = 1,078, FC > 1.5, AR binding sites within 500 kb from TSS, P = 3.52 × 10⁻¹³) effect on the 1,078 AR target genes without SD70 binding sites. (E) AR protein level measurement upon indicated concentration of SD70 treatment for 24 h before Western blot. AR(441) antibody was used to detect endogenous AR protein, and tubulin served as a loading control. (F) LNCaP cells were hormone-stripped for 3 d and pretreated by SD70 (10 μM, 24 h), which were further treated with vehicle or DHT (100 nM, 1 h) and subjected to AR ChIP-seq. The average tag profile analysis of the aligned AR peaks showing SD70 does not affect AR binding to target loci globally (Kolmogorov–Smirnov test, P = 0.985 between AR + DHT and AR + DHT SD70). (G) Snapshot of AR peaks does not change upon SD70 treatment, as shown by the UCSC genome browser.
Fig. 4.
Fig. 4.
SD70 suppresses gene transcription through H3K9me2 regulation. (A) In vitro KDM4C demethylation assay showing the SD70 inhibition effect on H3K9me2 and H3K9me3 demethylation using histone from calf thymus as a substrate. (B) Western blot measurement of various histone marks in cells treated with different concentrations of SD70 for 24 h in 293T cells. Ponceau S staining for histone was shown as a loading control. (C) KDM4C ChIP-qPCR on indicated AR target gene enhancer loci. “e” represents the enhancer and the qPCR error bars indicate the SD of two repeats (*P < 0.05 and **P < 0.01). (D) RT-qPCR analyses of representative AR targets in LNCaP cells transfected with KDM4C or negative control siRNA. KDM4C itself showed knockdown efficiency. Error bars indicate SD of three repeats for KDM4C and two repeats for AR target genes. Cells were stripped for 3 d before being subjected to DHT (100 nM) stimulation for 8 h (*P < 0.05 and **P < 0.01). (E) siKDM4C knockdown suppresses the top 300 DHT-inducted gene expressions revealed by RNA-seq, but no effect on randomly chosen non–DHT-regulated genes. The RNA-seq procedure is described in SI Methods. (F) Average tag density profile centered on AR and H3K4me1 cooccupancy peaks showing the focal tag density of SD70 on AR enhancers with increased binding of KDM4C after DHT (100 nM) treatment for 1 h, as revealed by KDM4C ChIP-seq. (G) ChIP-qPCR indicates increased H3K9me2 mark on AR canonical targets enhancer and promoter. Error bars indicate the SD of three repeats (*P < 0.05 and **P < 0.01).
Fig. 5.
Fig. 5.
SD70 inhibits prostate cancer cell growth in vitro and tumor growth in vivo. (A) Growth curve of CWR22Rv1 cells with SD70 treatment concentrations indicated. Error bars indicate the SD of six repeats. (B) Growth curve of a CWR22Rv1 cell xenograft mouse model. The drug was given as 10 mg/kg i.p. injection once a day. Vehicle treatment served as the control. Time 0 indicates the first time point for treatment (n = 6 for the control group and n = 8 for the drug treatment group; **P < 0.01). Error bars stand for SD.

References

    1. Schenone M, Dančík V, Wagner BK, Clemons PA. Target identification and mechanism of action in chemical biology and drug discovery. Nat Chem Biol. 2013;9(4):232–240. - PMC - PubMed
    1. Drews J. Stategic trends in the drug industry. Drug Discov Today. 2003;8(9):411–420. - PubMed
    1. Hawkins RD, Hon GC, Ren B. Next-generation genomics: An integrative approach. Nat Rev Genet. 2010;11(7):476–486. - PMC - PubMed
    1. Bell O, Tiwari VK, Thomä NH, Schübeler D. Determinants and dynamics of genome accessibility. Nat Rev Genet. 2011;12(8):554–564. - PubMed
    1. Zhou VW, Goren A, Bernstein BE. Charting histone modifications and the functional organization of mammalian genomes. Nat Rev Genet. 2011;12(1):7–18. - PubMed

Publication types

Associated data