. 2014 Jun 13:14:164.
doi: 10.1186/1471-2229-14-164.

Moderate drought causes dramatic floral transcriptomic reprogramming to ensure successful reproductive development in Arabidopsis

Affiliations

Moderate drought causes dramatic floral transcriptomic reprogramming to ensure successful reproductive development in Arabidopsis

Xuan Ma et al. BMC Plant Biol. .

Abstract

Background: Drought is a major constraint that leads to extensive losses to agricultural yield worldwide. The potential yield is largely determined during inflorescence development. However, to date, most investigations on plant response to drought have focused on vegetative development. This study describes the morphological changes of reproductive development and the comparison of transcriptomes under various drought conditions.

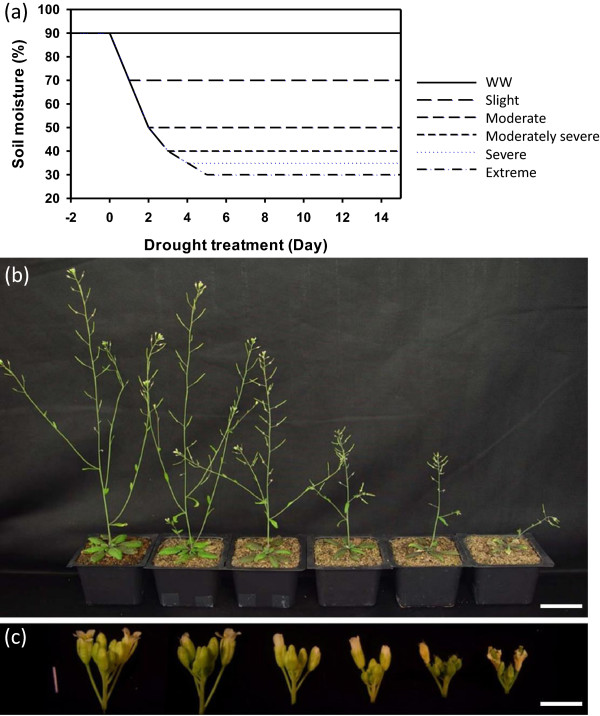
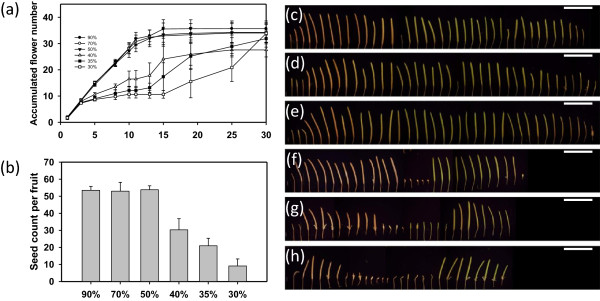
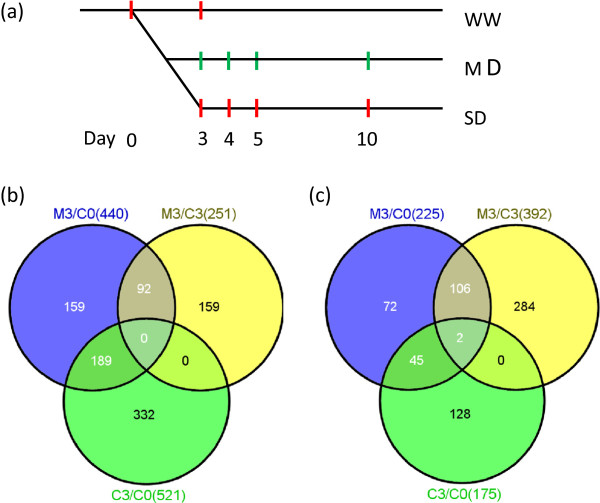
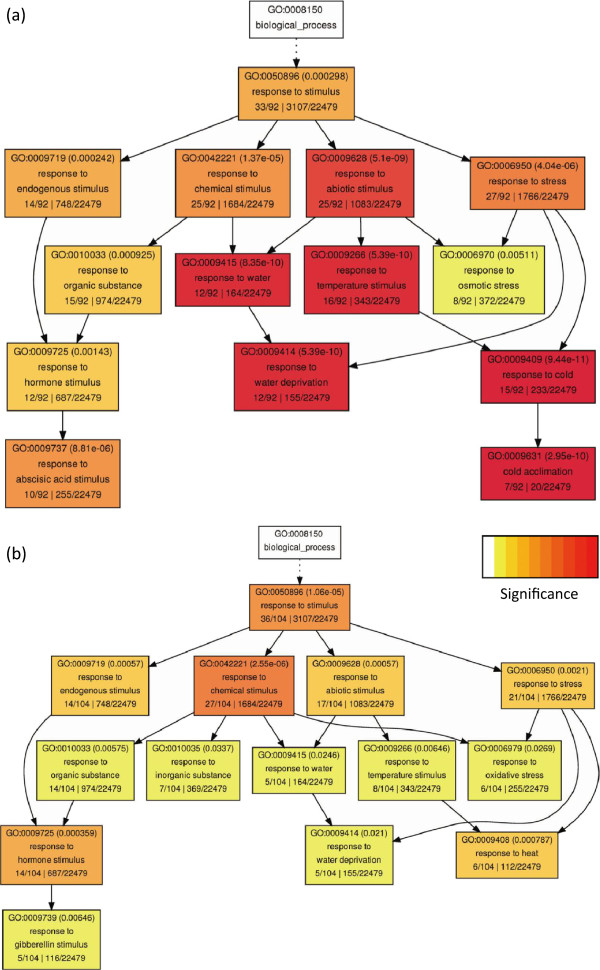
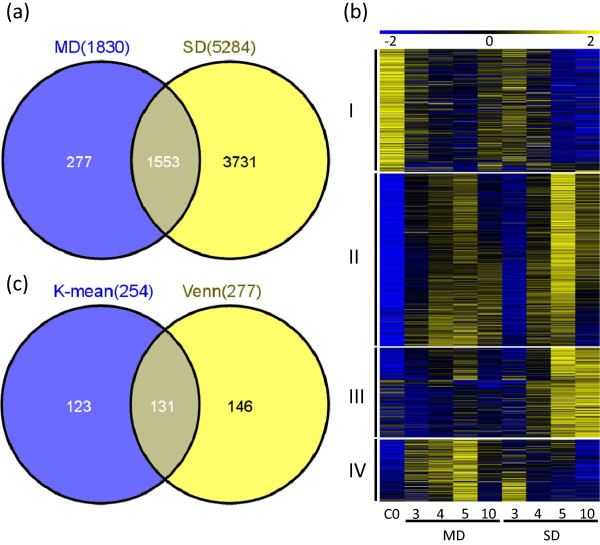
Results: The plants grown were studied under two drought conditions: minimum for successful reproduction (45-50% soil water content, moderate drought, MD) and for survival (30-35%, severe drought, SD). MD plants can produce similar number of siliques on the main stem and similar number of seeds per silique comparing with well-water plants. The situation of SD plants was much worse than MD plants. The transcriptomes of inflorescences were further investigated at molecular level using microarrays. Our results showed more than four thousands genes with differential expression under severe drought and less than two thousand changed under moderate drought condition (with 2-fold change and q-value < 0.01). We found a group of genes with increased expression as the drought became more severe, suggesting putative adaptation to the dehydration. Interestingly, we also identified genes with alteration only under the moderate but not the severe drought condition, indicating the existence of distinct sets of genes responsive to different levels of water availability. Further cis-element analyses of the putative regulatory sequences provided more information about the underlying mechanisms for reproductive responses to drought, suggesting possible novel candidate genes that protect those developing flowers under drought stress.

Conclusions: Different pathways may be activated in response to moderate and severe drought in reproductive tissues, potentially helping plant to maximize its yield and balance the resource consumption between vegetative and reproductive development under dehydration stresses.


Figures

Figure 1
Figure 1
Experimental design of different drought severities and overview of phenotypical changes of plant under drought. (a) Time course of soil moisture measurement during the drought treatment, the x-axis indicates the start and the duration of drought. (b) Whole plants were photographed after ten days of treatment under six conditions (from left to right: Well-watered, Slight drought, Moderate drought, Moderately severe drought, Severe drought, Extreme drought). (c) Inflorescences dissected from the plants in panel b were photographed. Bars represent 5 cm in (b) and 3 mm in (c).
Figure 2
Figure 2
Characterization of reproductive development under different drought severities. (a) The accumulated flower numbers were affected by drought stress; (b) The seeds count per silique on main stems under different drought severities; (c)-(h) Drought stress affected the number of siliques, (c) Well-watered; (d) Slight drought; (e) Moderate drought; (f) Moderately severe drought; (g) Severe drought; (h) Extreme drought. Bar = 2 cm.
Figure 3
Figure 3
Sample collection and transcriptomes from day 3 inflorescences to reveal plants early response to drought. (a) Samples were collected at C0, C3 for WW plants and M3, M4, M5, M10 for MD plants. For comparison, T3, T4, T5, T10 for DT plants were from a previous study [11]. (b) A Venn diagram for up-regulated genes of M3 compared with C0, M3 compared with C3, and C3 compared with C0. (c) A Venn diagram down-regulated genes for the same comparisons as in (b).
Figure 4
Figure 4
GO enrichment analysis of the gene group that differentially expressed in both severe and moderate drought condition. (a) The list of genes obtained from the overlapping gene group in both M3/C0 and M3/C3 in Figure  3b. (b) The list of genes from the overlapping gene group in both M3/C0 and M3/C3 in Figure  3c. Significance bar represents p-value from 1 × 10-1 to 1 × 10-10. P-values are shown in bracket of each box and gene count of each group is also included in the bottom line of the same box.
Figure 5
Figure 5
Comparison of transcriptomes of inflorescence under moderate drought and severe drought. (a) Venn diagram analysis showed the comparison on the differential expressed genes from moderate and severe drought treated plants. (b) K-means clustering of differentially expressed genes (1830) of moderate drought condition. The number indicates the fold change based on the normalized values of the hybridization signals in log2 format between one of the drought-treated groups and the control group (C0). (c) Comparison of the genes in the cluster IV of panel b (254 genes) with the genes specifically differentially expressed in moderate drought (277 genes in panel a).
Figure 6
Figure 6
Hierarchical clustering of NF-Y gene family under drought condition. Yellow color represents high expression while blue color represents low expression. Hierarchical clustering was performed on transcripts ratios of all conditions. C represents control: well-watered group; MD represents moderate drought; SD represents severe drought.

References

    1. Golldack D, Luking I, Yang O. Plant tolerance to drought and salinity: stress regulating transcription factors and their functional significance in the cellular transcriptional network. Plant Cell Rep. 2011;30(8):1383–1391. doi: 10.1007/s00299-011-1068-0. - DOI - PubMed
    1. Blum A. Drought resistance, water-use efficiency, and yield potential - are they compatible, dissonant, or mutually exclusive? Aust J Agr Res. 2005;56(11):1159–1168. doi: 10.1071/AR05069. - DOI
    1. Blum A. Improving wheat grain filling under stress by stem reserve mobilisation. Euphytica. 1998;100(1–3):77–83.
    1. Finkelstein RR, Gampala SSL, Rock CD. Abscisic acid signaling in seeds and seedlings. Plant Cell. 2002;14:S15–S45. - PMC - PubMed
    1. van der Weele CM, Spollen WG, Sharp RE, Baskin TI. Growth of Arabidopsis thaliana seedlings under water deficit studied by control of water potential in nutrient-agar media. J Exp Bot. 2000;51(350):1555–1562. doi: 10.1093/jexbot/51.350.1555. - DOI - PubMed

Publication types

MeSH terms

Associated data