. 2014 Jul;21(7):585-90.
doi: 10.1038/nsmb.2842. Epub 2014 Jun 15.

Dicer-microRNA-Myc circuit promotes transcription of hundreds of long noncoding RNAs

Affiliations

Dicer-microRNA-Myc circuit promotes transcription of hundreds of long noncoding RNAs

Grace X Y Zheng et al. Nat Struct Mol Biol. 2014 Jul.

Abstract

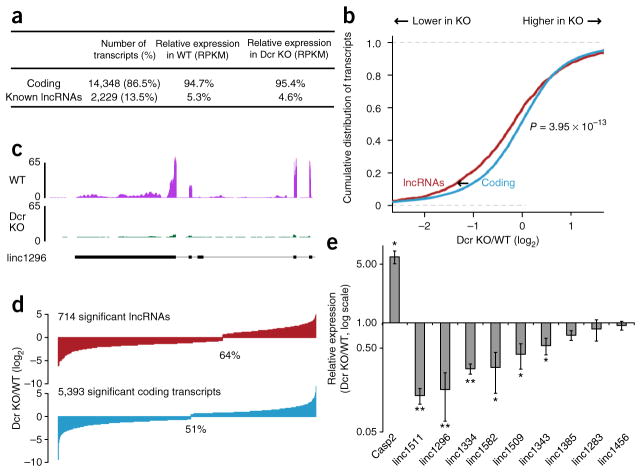
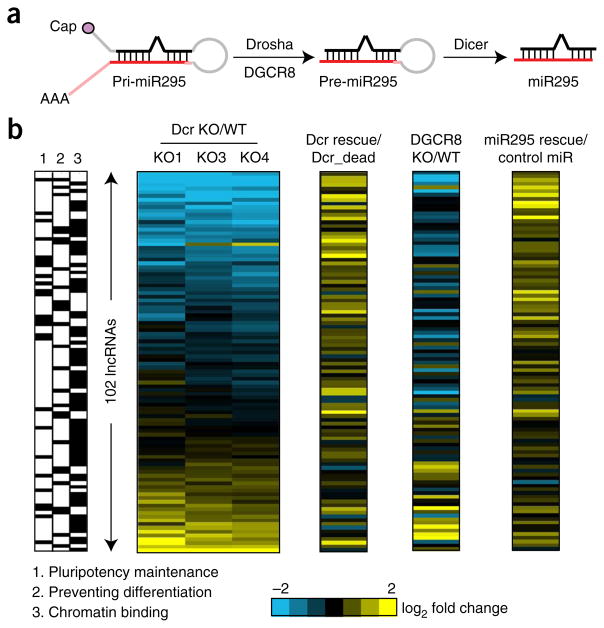
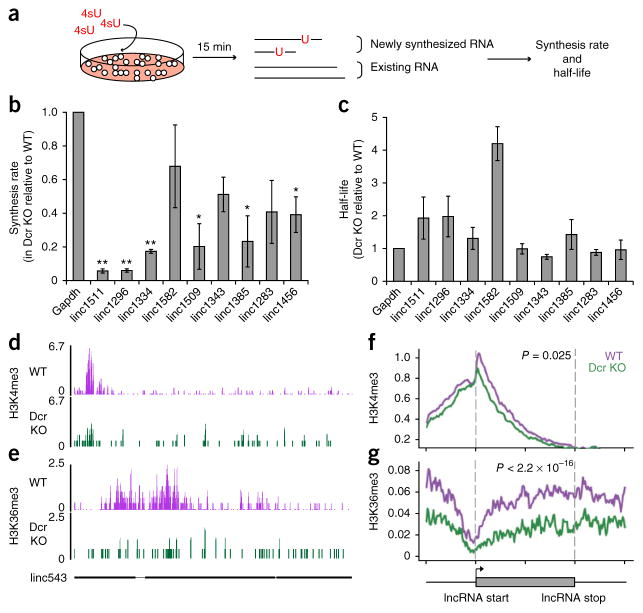
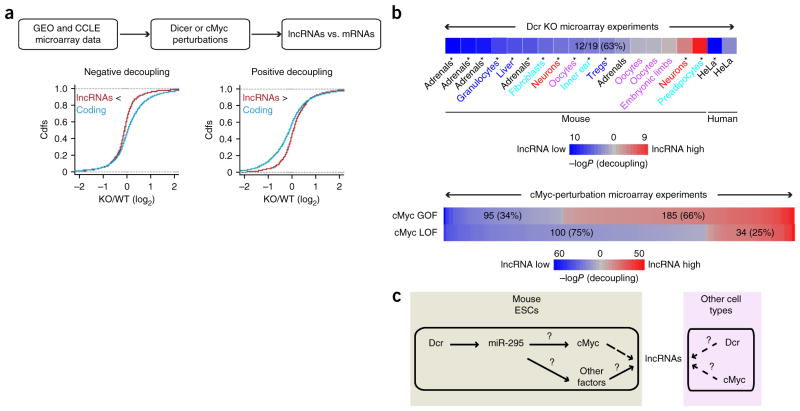
Long noncoding RNAs (lncRNAs) are important regulators of cell fate, yet little is known about mechanisms controlling lncRNA expression. Here we show that transcription is quantitatively different for lncRNAs and mRNAs--as revealed by deficiency of Dicer (Dcr), a key RNase that generates microRNAs (miRNAs). Dcr loss in mouse embryonic stem cells led unexpectedly to decreased levels of hundreds of lncRNAs. The canonical Dgcr8-Dcr-miRNA pathway is required for robust lncRNA transcriptional initiation and elongation. Computational and genetic epistasis analyses demonstrated that Dcr activation of the oncogenic transcription factor cMyc is partly responsible for lncRNA expression. A quantitative metric of mRNA-lncRNA decoupling revealed that Dcr and cMyc differentially regulate lncRNAs versus mRNAs in diverse cell types and in vivo. Thus, numerous lncRNAs may be modulated as a class in development and disease, notably where Dcr and cMyc act.


Conflict of interest statement

COMPETING FINANCIAL INTERESTS

The authors declare no competing financial interests.

Figures

Figure 1
Figure 1
Global lncRNA downregulation in Dcr-KO mESCs. (a) Breakdown of classes of transcripts and their abundance in WT and Dcr-KO mESCs. RPKM, reads per kilobase per million. (b) Cumulative distribution functions (cdfs) of log2 fold change (LFC) of lncRNAs (red) and coding transcripts (blue) between Dcr WT and KO mESCs (n = 3 KO lines; P = 3.95 × 10⁻¹³ by two-sided Wilcoxon rank-sum test). (c) Sequencing tracks of long intergenic noncoding (linc) RNA linc1296 (nomenclature from ref. 10). The y axis represents number of reads per million. The gene structure of linc1296 is shown at the bottom in black, with the exons as black boxes. (d) Bar plots of log2 fold change of lncRNAs and protein-coding transcripts with significantly changed expression between Dcr WT and KO mESCs. (e) Expression of nine lncRNAs and one known miR-295–target, Casp2, validated by RT-qPCR (n = 3 experiments, mean ± s.e.m., *P ≤ 0.05; **P ≤ 0.01 by two-sided t test).
Figure 2
Figure 2
Canonical microRNA pathway and miR-295 are required for lncRNA expression. (a) Schematic of the canonical miRNA pathway. (b) NanoString measurement of expression of 102 lncRNAs in three lines of Dcr-KO mESCs (normalized to WT), Dcr rescue in Dcr KO (normalized to the catalytically dead mutants), Dgcr8 KO (normalized to Dgcr8 WT) and miR-295 rescue in Dcr KO (normalized to a control miRNA mimic). The box on the left shows the ability of lncRNAs to maintain pluripotency (column 1) and to prevent differentiation (column 2) as well as their binding to chromatin (column 3), as cross-referenced with data from ref. . The blue and yellow colors in the heat map indicate down- and upregulated lncRNAs respectively (n = 2 cultures each).
Figure 3
Figure 3
Dicer promotes lncRNA expression at the level of lncRNA transcription. (a) Schematic of 4sU experiment in WT and Dcr-KO mESCs. (b,c) Synthesis rate and half-life of lncRNAs, measured in Dcr WT and KO mESCs and displayed as a ratio of KO and WT (n = 3 trials for lincRNAs and n = 4 for Gapdh; *P ≤ 0.05; **P ≤ 0.01 by two-sided t test). Error bars, s.e.m. (d,e) Sequencing signals of H3K4me3 and H3K36me3 in WT (purple) and Dcr KO (green) mESCs at linc543 (nomenclature from ref. 15). The y axis represents number of reads per million. The gene structure of linc543 is shown at the bottom in black, with exons shown as black boxes. (f,g) Average signal intensity of H3K4me3 and H3K36me3 across downregulated lncRNA genes in WT (purple) and Dcr KO (green) mESCs. y axis represents average log2 value of normalized reads. P values indicate the significance of the area difference between WT and KO signals within the dotted line (two-sided Wilcoxon rank-sum test, n = 100 data points). The gray box at bottom represents the beginning and the end of an average lncRNA gene. The signals were also plotted for 50% up- and downstream of each lncRNA gene.
Figure 4
Figure 4
cMyc-binding sites of lncRNAs affect their sensitivity to Dcr loss. (a) cMyc-binding-site enrichment in Dcr-dependent lncRNA genes. Top inset, schematic of bioinformatics strategy. TF, transcription factor; DB, database. Bottom inset, cMyc downregulation in Dcr-KO mESCs. RPKM, reads per kilobase per million. (b) cMyc ChIP-seq binding data, plotted alongside the expression change of lncRNAs in Dcr KO. (c) Cumulative distribution functions (cdfs) of log2 fold change (LFC) for lncRNA genes (dark red) and protein-coding genes (blue) between cMycflox/flox (denoted f/f) and cMyc−/− mESCs. lncRNA genes with cMyc-binding sites are shown in red, and lncRNA genes without cMyc-binding sites are shown in gray. lncRNAs (especially those encoded by lncRNA genes with cMyc-binding sites) are significantly downregulated in cMyc−/− mESCs relative to protein-coding genes (P < 2.2 × 10⁻¹⁶ by two-sided Wilcoxon rank-sum test, n = 2,229 known lncRNA transcripts). (d) NanoString measurement of expression of 102 lncRNAs in three lines of Dcr-KO mESCs (K01–K03, normalized to WT, as in Fig. 2b) and cMyc rescue in Dcr KO (normalized to the control plasmid). The blue and yellow colors in the heat map indicate down- and upregulated lncRNAs respectively (n = 2 cultures). (e) Changes in intensity of H3K4me3 (left) and H3K36me3 (right) at lncRNA genes with (red) or without (gray) cMyc-binding sites between WT and Dcr-KO mESCs.
Figure 5
Figure 5
Loss of Dcr and cMyc leads to a more severe change in expression of lncRNAs than of mRNAs in diverse cellular contexts. (a) Flowchart depicting the search for experiments that exhibit differential expression change of lncRNAs and mRNAs. GEO was mined for Dicer KO experiments, and CCLE was mined for cMyc perturbation experiments. Examples of negative and positive decoupling are shown in graphs. (b) LncRNA and mRNA regulation compared in 19 mouse and human tissues after Dicer knockout (top) and 415 human cell lines after cMyc perturbation (bottom). Blue represents downregulation of lncRNAs relative to protein-coding transcripts, and red represents upregulation of lncRNAs relative to protein-coding transcripts. GOF, gain of function; LOF, loss of function. The intensity of the color reflects the significance, determined by the Kolmogorov-Smirnov (KS) test (*P ≤ 0.05 at top; numbers at bottom indicate significant experiments with P ≤ 0.05). (c) A general model of lncRNA regulation by Dicer and cMyc. Solid arrows, known interactions; question mark, unknown mechanism; dashed arrows, new interactions shown in this work.

References

    1. Rinn JL, Chang HY. Genome regulation by long noncoding RNAs. Annu Rev Biochem. 2012;81:145–166. - PMC - PubMed
    1. Batista PJ, Chang HY. Long noncoding RNAs: cellular address codes in development and disease. Cell. 2013;152:1298–1307. - PMC - PubMed
    1. Bartel DP. MicroRNAs: target recognition and regulatory functions. Cell. 2009;136:215–233. - PMC - PubMed
    1. Jeggari A, Marks DS, Larsson E. miRcode: a map of putative microRNA target sites in the long non-coding transcriptome. Bioinformatics. 2012;28:2062–2063. - PMC - PubMed
    1. Cesana M, et al. A long noncoding RNA controls muscle differentiation by functioning as a competing endogenous RNA. Cell. 2011;147:358–369. - PMC - PubMed

Publication types

MeSH terms

Associated data