. 2014 Jun 14:13:233.
doi: 10.1186/1475-2875-13-233.

Distinct patterns of diversity, population structure and evolution in the AMA1 genes of sympatric Plasmodium falciparum and Plasmodium vivax populations of Papua New Guinea from an area of similarly high transmission

Affiliations

Distinct patterns of diversity, population structure and evolution in the AMA1 genes of sympatric Plasmodium falciparum and Plasmodium vivax populations of Papua New Guinea from an area of similarly high transmission

Alicia Arnott et al. Malar J. .

Abstract

Background: As Plasmodium falciparum and Plasmodium vivax co-exist in most malaria-endemic regions outside sub-Saharan Africa, malaria control strategies in these areas must target both species in order to succeed. Population genetic analyses can predict the effectiveness of interventions including vaccines, by providing insight into patterns of diversity and evolution. The aim of this study was to investigate the population genetics of leading malaria vaccine candidate AMA1 in sympatric P. falciparum and P. vivax populations of Papua New Guinea (PNG), an area of similarly high prevalence (Pf = 22.3 to 38.8%, Pv = 15.3 to 31.8%).

Methods: A total of 72 Pfama1 and 102 Pvama1 sequences were collected from two distinct areas, Madang and Wosera, on the highly endemic PNG north coast.

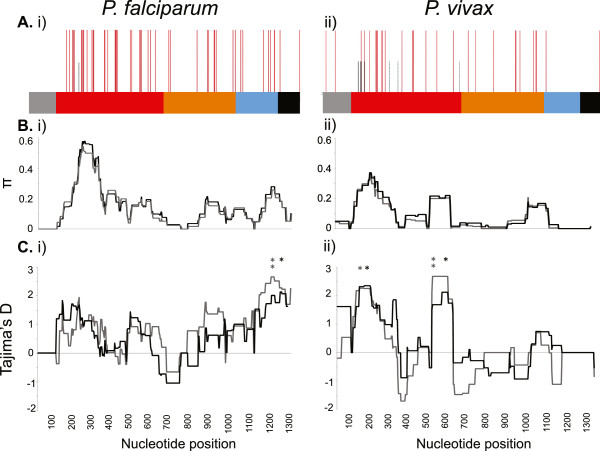
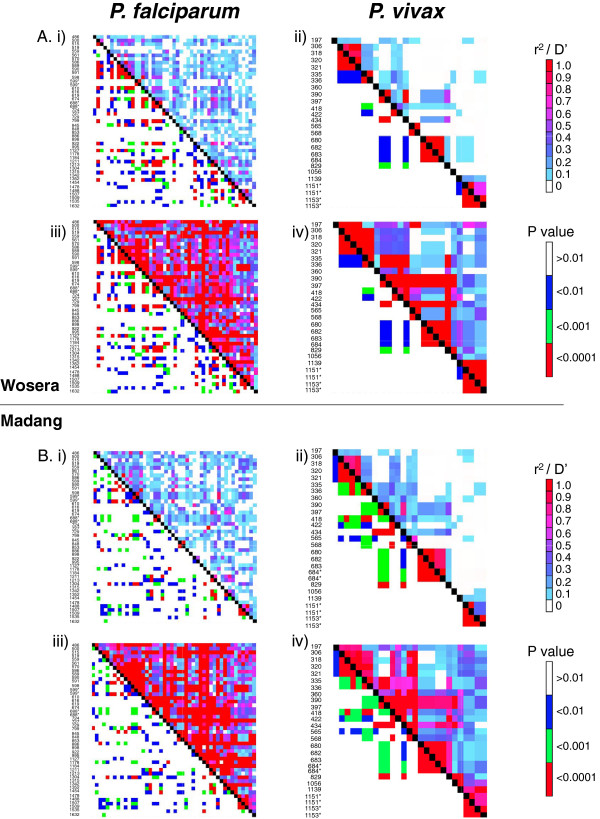
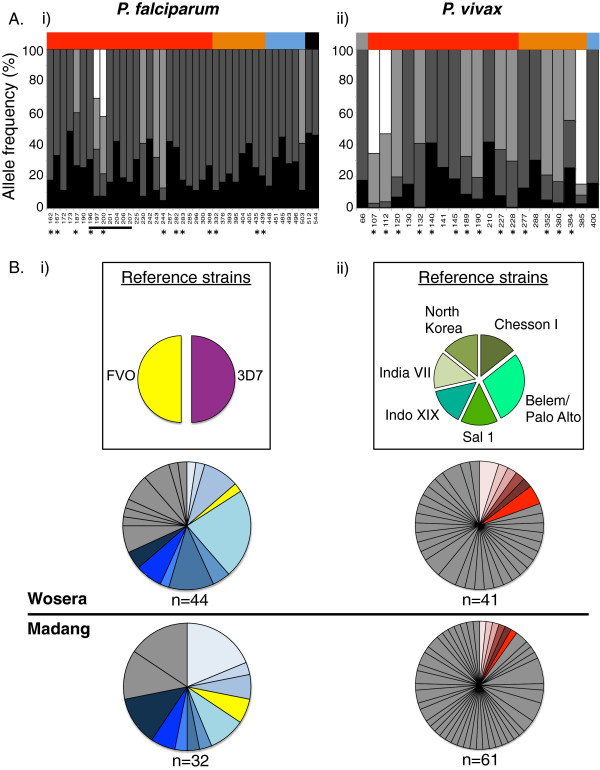
Results: Despite a greater number of polymorphic sites in the AMA1 genes of P. falciparum (Madang = 52; Wosera = 56) compared to P. vivax (Madang = 36, Wosera = 34), the number of AMA1 haplotypes, haplotype diversity (Hd) and recombination (R) was far lower for P. falciparum (Madang = 12, Wosera = 20; Hd ≤0.92, R ≤45.8) than for P. vivax (Madang = 50, Wosera = 38; Hd = 0.99, R = ≤70.9). Balancing selection was detected only within domain I of AMA1 for P. vivax, and in both domains I and III for P. falciparum.

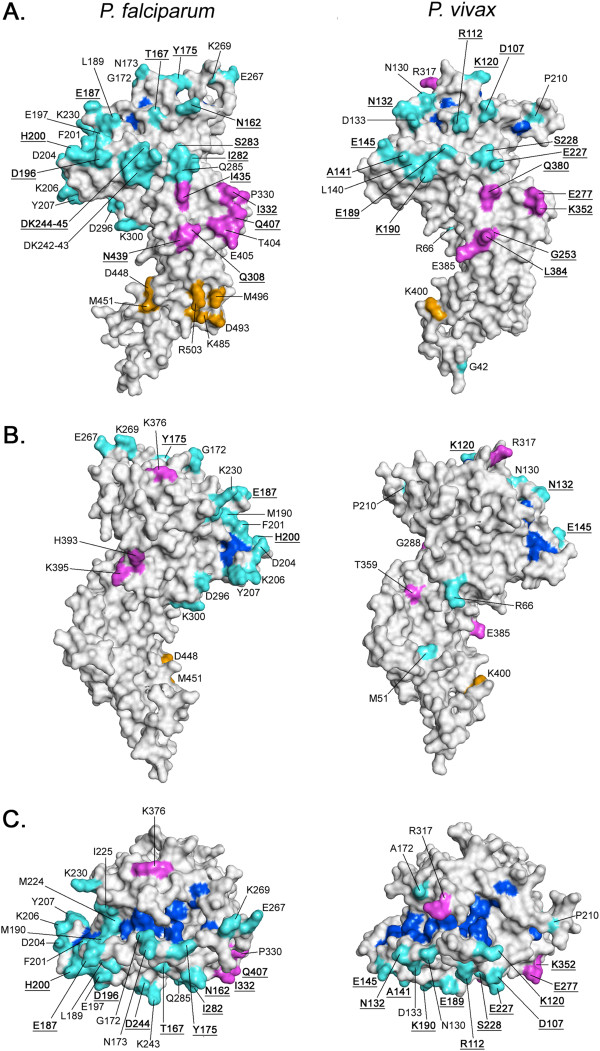
Conclusions: Higher diversity in the genes encoding P. vivax AMA1 than in P. falciparum AMA1 in this highly endemic area has important implications for development of AMA1-based vaccines in PNG and beyond. These results also suggest a smaller effective population size of P. falciparum compared to P. vivax, a finding that warrants further investigation. Differing patterns of selection on the AMA1 genes indicate that critical antigenic sites may differ between the species, highlighting the need for independent investigations of these two leading vaccine candidates.


Figures

Figure 1
Figure 1
Polymorphism and selection of AMA1 genes in Plasmodium falciparum and Plasmodium vivax populations of Papua New Guinea. The following results are based on the total dataset of 76 P. falciparum and 102 P. vivax sequences A) Polymorphism: Schematic of the (i) P. falciparum and (ii) P. vivax genes encoding the AMA1 ectodomain, with all polymorphisms including non-synonymous (NS SNP, red lines), synonymous (SP SNP, black lines) and singleton (dashed red and black lines, respectively) sites shown. Location of residues is indicated by the colored panel along the top of the chart: signal sequence (grey), DI (red), DII (orange), DIII (blue), transmembrane region (black). B) Nucleotide diversity: Sliding window analysis showing nucleotide diversity (π values for (i) Pfama1 and (ii) Pvama1. A window size of 100 bp and a step size of 3 bp were used. C) Natural selection. Sliding window calculation of Tajima’s D was performed for all (i) 76 Pfama1 sequences and (ii) 102 Pvama1 sequences (black = Madang; grey = Wosera). A window size of 100 and a step size of 3 were used. A single asterisk (black = Madang; grey = Wosera) indicates significant values for which p <0.05; and double asterisk indicates p <0.01.
Figure 2
Figure 2
Linkage disequilibrium in AMA1 genes of Plasmodium falciparum and Plasmodium vivax populations in Papua New Guinea. The indices of linkage disequilibrium (LD), r2 (i and ii) and D’ (iii and iv) were calculated for all AMA1 polymorphisms with a MAF ≥0.10 for (A) Wosera and (B) Madang populations. SNP position is shown on the Y axis and black squares represent self comparisons. Numbering is relative to the Pfama1 3D7 reference sequence (GenBank accession no: XM_001347979.1) and the Pvama1 Sal-1 reference sequence (GenBank accession no: AF063138), respectively. Coloured squares above the black diagonal represent values obtained for each pair of sites following r2 or D' calculations. Below the black diagonal line on each heat map, coloured squares reflect the significance value (p). An asterisk denotes tri-allelic SNPs that were split into two so that the major allele was analysed separately with each of the minor alleles. For interpretation, see the scale to the right of diagrams.
Figure 3
Figure 3
Three-dimensional structural model of Plasmodium falciparum and Plasmodium vivax AMA1 polymorphisms. A) Solvent-accessible surface representation of the ‘active face’ of the PfAMA1 and PvAMA1 three-dimensional (3D) models. Polymorphic residues are colored according to location: DI in cyan, DII in magenta, DIII in orange. Hydrophobic ligand binding cleft residues are shown in dark blue. Residues labeled with bold, underlined type are polymorphic in both P. falciparum and P. vivax. Residues of potential immunological relevance with a MAF ≥0.10 are indicated with an asterisk. B) Solvent-accessible surface representation of the ‘silent face’ of the PfAMA1 and PvAMA1 models. The hydrophobic cleft and polymorphic residues are shown, with coloring and labeling as described for panel A. C) Solvent-accessible surface representation of the PfAMA1 and PvAMA1 models showing a top-view of the hydrophobic binding cleft. Hydrophobic cleft and polymorphic residues are shown, with coloring and labeling as described for panel A. Note that for PfAMA1, hydrophobic cleft residues M224 and M190 are polymorphic and colored cyan (not dark blue) as they are in DI.
Figure 4
Figure 4
Frequency of AMA1 polymorphisms and haplotypes in Plasmodium falciparum and Plasmodium vivax populations in Papua New Guinea. A) Polymorphisms. The frequencies of common polymorphisms are shown for (i) PfAMA1 (n = 41) and (ii) PvAMA1 (n = 18). Location of residues is indicated by the colored panel along the top of the chart: signal sequence (grey), DI (red), DII (orange), DIII (blue), transmembrane region (black). Allele frequencies are indicated by the proportion of each bar shaded. Sites that are polymorphic in both species are indicated by an asterisk. Antigenic escape residues defined for PfAMA1 (the “c1L” cluster) are indicated by the horizontal black line (ii). B) Haplotypes. Frequencies of haplotypes based on common polymorphisms for (i) PfAMA1 (n = 21) and (ii) PvAMA1 (n = 78). Coloured segments indicate shared haplotypes between the two populations and grey indicates those unique to one population. The size of the fragment reflects the relative frequency of the haplotype within the population. Reference strain haplotypes are colored to highlight presence/absence in the populations investigated. For PfAMA1, only one haplotype was identical to a reference strain (FVO). No naturally circulating PvAMA1 strains shared haplotypes with any of the reference strains analysed, and thus they are shown in grey. Sample size (n) and origin are indicated.

Similar articles

Cited by

References

    1. Genton B, D'Acremont V, Rare L, Baea K, Reeder JC, Alpers MP, Muller I. Plasmodium vivax and mixed infections are associated with severe malaria in children: a prospective cohort study from Papua New Guinea. PLoS Med. 2008;5:e127. - PMC - PubMed
    1. Price RN, Tjitra E, Guerra CA, Yeung S, White NJ, Anstey NM. Vivax malaria: neglected and not benign. Am J Trop Med Hyg. 2007;77:79–87. - PMC - PubMed
    1. Barcus MJ, Basri H, Picarima H, Manyakori C, Sekartuti, Elyazar I, Bangs MJ, Maguire JD, Baird JK. Demographic risk factors for severe and fatal vivax and falciparum malaria among hospital admissions in northeastern Indonesian Papua. Am J Trop Med Hyg. 2007;77:984–991. - PubMed
    1. Tjitra E, Anstey NM, Sugiarto P, Warikar N, Kenangalem E, Karyana M, Lampah DA, Price RN. Multidrug-resistant Plasmodium vivax associated with severe and fatal malaria: a prospective study in Papua. Indonesia PLoS Med. 2008;5:e128. - PMC - PubMed
    1. Guerra CA, Howes RE, Patil AP, Gething PW, Van Boeckel TP, Temperley WH, Kabaria CW, Tatem AJ, Manh BH, Elyazar IR, Baird JK, Snow RW, Hay SI. The international limits and population at risk of Plasmodium vivax transmission in 2009. PLoS Negl Trop Dis. 2010;4:e774. - PMC - PubMed

Publication types

MeSH terms

Associated data

LinkOut - more resources