

Odd-skipped related 1 is a novel tumour suppressor gene and a potential prognostic biomarker in gastric cancer
- PMID: 24931004
- PMCID: PMC4277686
- DOI: 10.1002/path.4391
Odd-skipped related 1 is a novel tumour suppressor gene and a potential prognostic biomarker in gastric cancer
Abstract
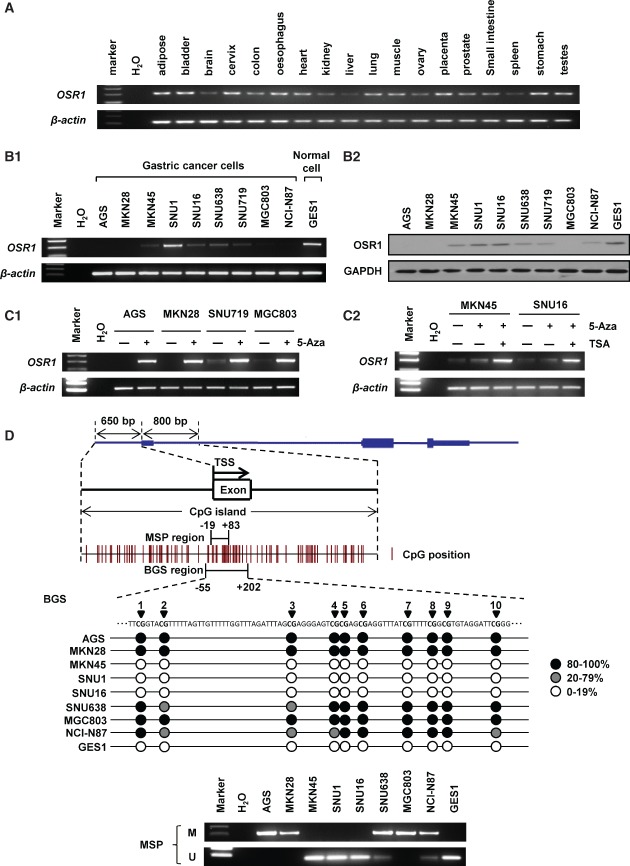
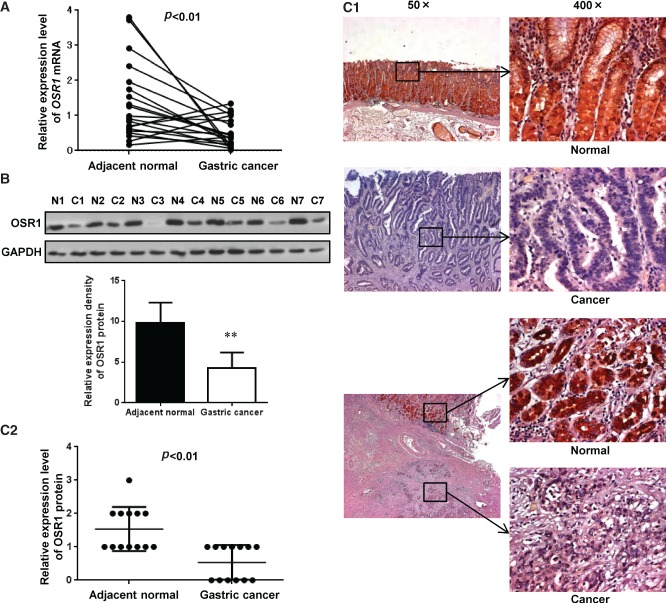
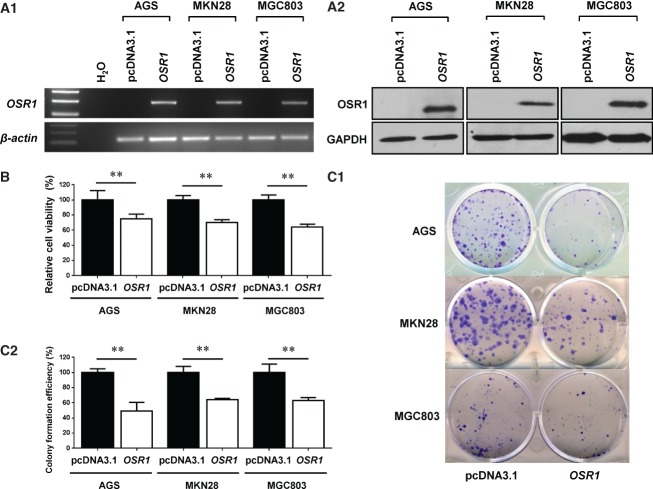
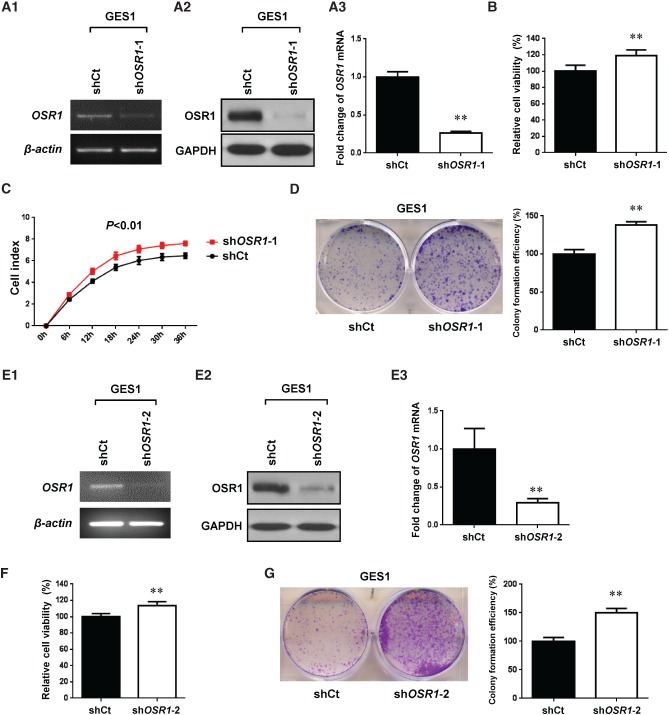
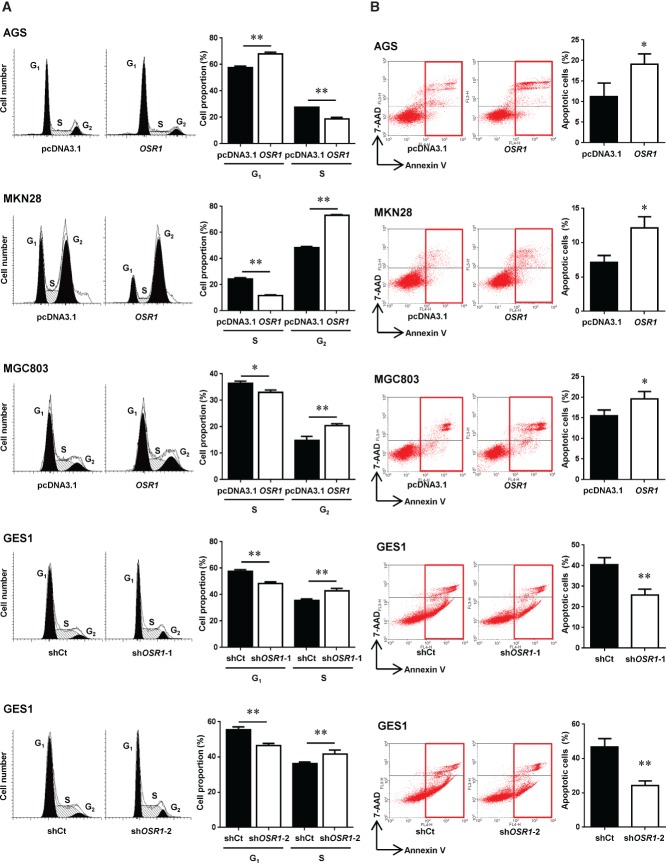
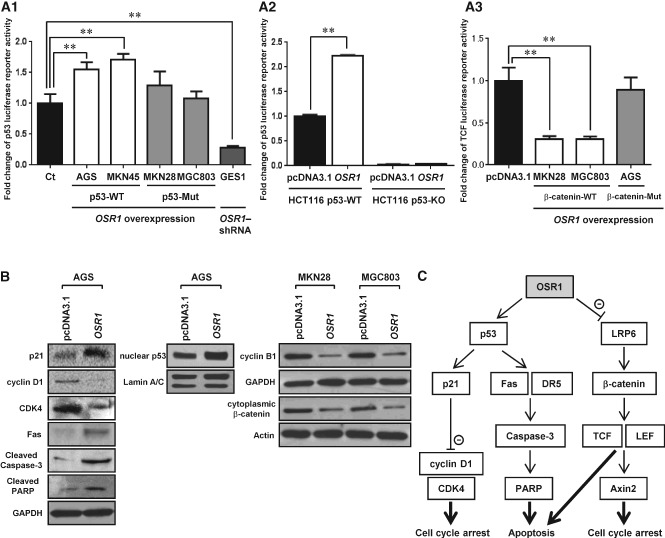
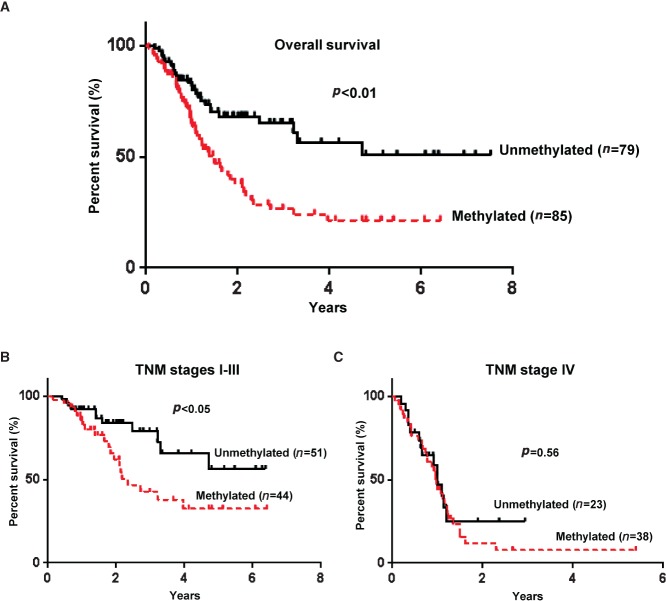
We report that the odd-skipped related 1 (OSR1) gene encoding a zinc-finger transcription factor was preferentially methylated in gastric cancer by genome-wide methylation screening. OSR1 expression was frequently silenced or down-regulated in gastric cancer cell lines. OSR1 expression was also significantly down-regulated at both mRNA and protein levels in primary gastric cancer tissues compared with adjacent normal tissues. The silencing or down-regulation of OSR1 was closely associated with promoter hypermethylation. Overexpression of OSR1 significantly inhibited cell growth, arrested the cell cycle, and induced apoptosis in the gastric cancer cell lines AGS, MKN28, and MGC803. Conversely, knockdown of OSR1 by OSR1-short hairpin RNA significantly enhanced cell growth, promoted the cell cycle, and inhibited apoptosis in the normal gastric epithelial cell line GES1. The dual-luciferase reporter assay revealed that OSR1 activated p53 transcription and repressed the T-cell factor (TCF)/lymphoid enhancer factor (LEF). Complementary DNA expression array and western blotting showed that OSR1 increased the expression of nuclear p53, p21, Fas, and death receptor-5, and suppressed the expression of cyclin D1 and cyclin-dependent kinase 4 in the p53 signalling pathway. In addition, OSR1 suppressed the expression of cytoplasmic β-catenin, TCF-1, and LEF1 in the Wnt/β-catenin signalling pathway. OSR1 methylation was detected in 51.8% of primary gastric cancer patients (85 of 164) by bisulphite genomic sequencing. Multivariate Cox regression analysis showed that OSR1 methylation was an independent predictor of poor survival. Kaplan-Meier survival curves revealed that OSR1 methylation was associated with shortened survival in TNM stage I-III patients. In conclusion, OSR1 acts as a functional tumour suppressor through the transcriptional activation of p53 and repression of TCF/LEF in gastric cancer. Detection of OSR1 methylation may serve as a potential biomarker of the early stage of gastric cancer.
Keywords: gastric cancer; methylation; odd-skipped related 1 (OSR1); prognosis; tumour suppressor.
© 2014 The Authors. The Journal of Pathology published by John Wiley & Sons Ltd on behalf of Pathological Society of Great Britain and Ireland.
Figures
Similar articles
-
Epigenetic inactivation of paired box gene 5, a novel tumor suppressor gene, through direct upregulation of p53 is associated with prognosis in gastric cancer patients.Oncogene. 2012 Jul 19;31(29):3419-30. doi: 10.1038/onc.2011.511. Epub 2011 Nov 21. Oncogene. 2012. PMID: 22105368
-
Zinc-finger protein 545 is a novel tumour suppressor that acts by inhibiting ribosomal RNA transcription in gastric cancer.Gut. 2013 Jun;62(6):833-41. doi: 10.1136/gutjnl-2011-301776. Epub 2012 May 12. Gut. 2013. PMID: 22580414
-
Epigenetic inactivation of BCL6B, a novel functional tumour suppressor for gastric cancer, is associated with poor survival.Gut. 2012 Jul;61(7):977-85. doi: 10.1136/gutjnl-2011-300411. Epub 2011 Sep 13. Gut. 2012. PMID: 21917650
-
Gene methylation in gastric cancer.Clin Chim Acta. 2013 Sep 23;424:53-65. doi: 10.1016/j.cca.2013.05.002. Epub 2013 May 10. Clin Chim Acta. 2013. PMID: 23669186 Review.
-
Search for new biomarkers of gastric cancer through serial analysis of gene expression and its clinical implications.Cancer Sci. 2004 May;95(5):385-92. doi: 10.1111/j.1349-7006.2004.tb03220.x. Cancer Sci. 2004. PMID: 15132764 Free PMC article. Review.
Cited by
-
Transcriptomic Analysis of Persistent Infection with Foot-and-Mouth Disease Virus in Cattle Suggests Impairment of Apoptosis and Cell-Mediated Immunity in the Nasopharynx.PLoS One. 2016 Sep 19;11(9):e0162750. doi: 10.1371/journal.pone.0162750. eCollection 2016. PLoS One. 2016. PMID: 27643611 Free PMC article.
-
Role of the Wnt/β-catenin pathway in gastric cancer: An in-depth literature review.World J Exp Med. 2015 May 20;5(2):84-102. doi: 10.5493/wjem.v5.i2.84. eCollection 2015 May 20. World J Exp Med. 2015. PMID: 25992323 Free PMC article. Review.
-
Osr1 regulates hepatic inflammation and cell survival in the progression of non-alcoholic fatty liver disease.Lab Invest. 2021 Apr;101(4):477-489. doi: 10.1038/s41374-020-00493-2. Epub 2020 Oct 1. Lab Invest. 2021. PMID: 33005011 Free PMC article.
-
Identification of 31 loci for mammographic density phenotypes and their associations with breast cancer risk.Nat Commun. 2020 Oct 9;11(1):5116. doi: 10.1038/s41467-020-18883-x. Nat Commun. 2020. PMID: 33037222 Free PMC article.
-
Reduced expression of odd-skipped related transcription factor 1 promotes proliferation and invasion of breast cancer cells and indicates poor patient prognosis.Oncol Lett. 2020 Sep;20(3):2946-2954. doi: 10.3892/ol.2020.11820. Epub 2020 Jul 7. Oncol Lett. 2020. PMID: 32782611 Free PMC article.
References
-
- Ferlay J, Shin HR, Bray F. Estimates of worldwide burden of cancer in 2008: GLOBOCAN 2008. Int J Cancer. 2010;127:2893–2917. - PubMed
-
- Otani K, Li X, Arakawa T. Epigenetic-mediated tumor suppressor genes as diagnostic or prognostic biomarkers in gastric cancer. Expert Rev Mol Diagn. 2013;13:445–455. - PubMed
-
- Kang GH, Lee S, Kim JS. Profile of aberrant CpG island methylation along multistep gastric carcinogenesis. Lab Invest. 2003;83:519–526. - PubMed
-
- Zhao J, Liang Q, Cheung KF. Genome-wide identification of Epstein–Barr virus-driven promoter methylation profiles of human genes in gastric cancer cells. Cancer. 2013;119:304–312. - PubMed
Publication types
MeSH terms
Substances
LinkOut - more resources
Full Text Sources
Other Literature Sources
Medical
Research Materials
Miscellaneous
