

Differential activation of placental unfolded protein response pathways implies heterogeneity in causation of early- and late-onset pre-eclampsia
- PMID: 24931423
- PMCID: PMC4277692
- DOI: 10.1002/path.4394
Differential activation of placental unfolded protein response pathways implies heterogeneity in causation of early- and late-onset pre-eclampsia
Abstract
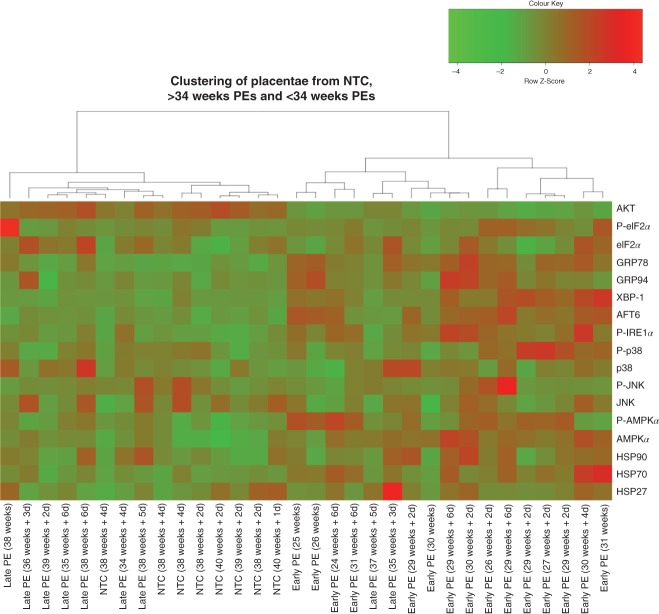
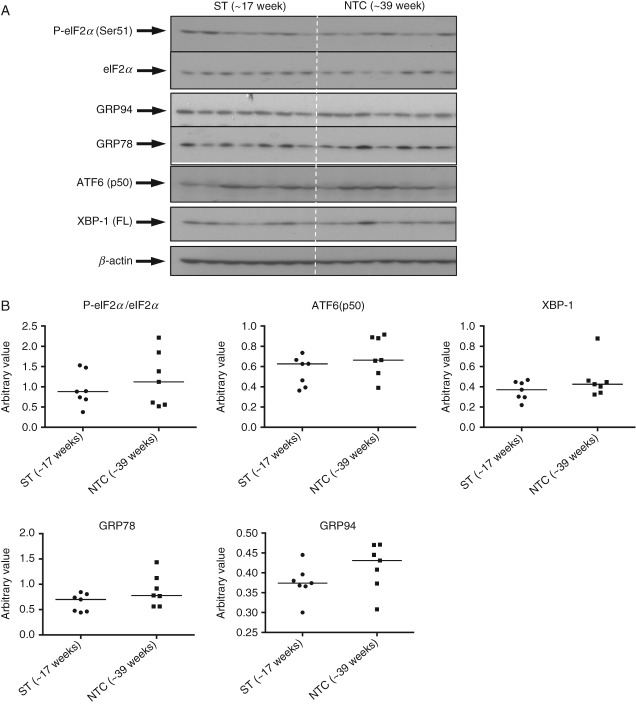
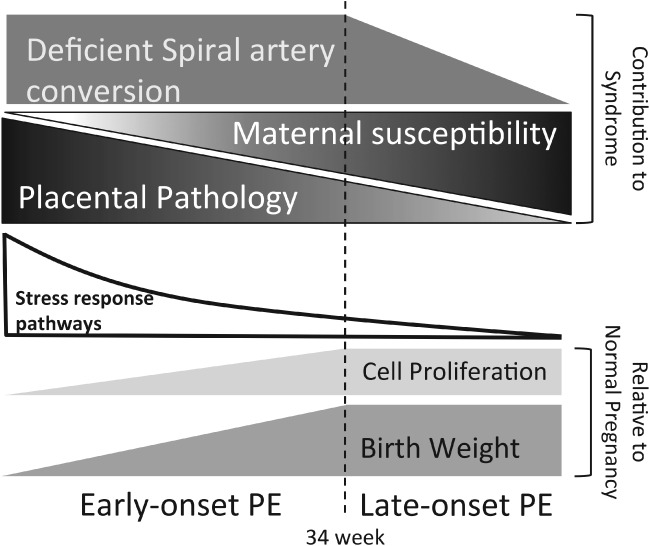
Based on gestational age at diagnosis and/or delivery, pre-eclampsia (PE) is commonly divided into early-onset (<34 weeks) and late-onset (≥34 weeks) forms. Recently, the distinction between 'placental' and 'maternal' causation has been proposed, with 'placental' cases being more frequently associated with early-onset and intrauterine growth restriction. To test whether molecular placental pathology varies according to clinical presentation, we investigated stress-signalling pathways, including unfolded protein response (UPR) pathways, MAPK stress pathways, heat-shock proteins and AMPKα in placentae delivered by caesarean section for clinical indications at different gestational ages. Controls included second-trimester, pre-term and normal-term placentae. BeWo cells were used to investigate how these pathways react to different severities of hypoxia-reoxygenation (H/R) and pro-inflammatory cytokines. Activation of placental UPR and stress-response pathways, including P-IRE1α, ATF6, XBP-1, GRP78 and GRP94, P-p38/p38 and HSP70, was higher in early-onset PE than in both late-onset PE and normotensive controls (NTCs), with a clear inflection around 34 weeks. Placentae from ≥ 34 weeks PE and NTC were indistinguishable. Levels of UPR signalling were similar between second-trimester and term controls, but were significantly higher in pre-term 'controls' delivered vaginally for chorioamnionitis and other conditions. Severe H/R (1/20% O2 ) induced equivalent activation of UPR pathways, including P-eIF2α, ATF6, P-IRE1α, GRP78 and GRP94, in BeWo cells. By contrast, the pro-inflammatory cytokines TNFα and IL-1β induced only mild activation of P-eIF2α and GRP78. AKT, a central regulator of cell proliferation, was reduced in the < 34 weeks PE placentae and severe H/R-treated cells, but not in other conditions. These findings provide the first molecular evidence that placental stress may contribute to the pathophysiology of early-onset pre-eclampsia, whereas that is unlikely to be the case in the late-onset form of the syndrome.
Keywords: cell stress responses; growth restriction; placenta; pre-eclampsia; pregnancy; unfolded protein response.
© 2014 The Authors. The Journal of Pathology published by John Wiley & Sons Ltd on behalf of Pathological Society of Great Britain and Ireland.
Figures


Similar articles
-
No evidence of the unfolded protein response in the placenta of two rodent models of preeclampsia and intrauterine growth restriction.Biol Reprod. 2021 Aug 3;105(2):449-463. doi: 10.1093/biolre/ioab087. Biol Reprod. 2021. PMID: 33955453
-
Placental endoplasmic reticulum stress negatively regulates transcription of placental growth factor via ATF4 and ATF6β: implications for the pathophysiology of human pregnancy complications.J Pathol. 2016 Mar;238(4):550-61. doi: 10.1002/path.4678. Epub 2016 Jan 12. J Pathol. 2016. PMID: 26648175 Free PMC article.
-
Noncanonical mitochondrial unfolded protein response impairs placental oxidative phosphorylation in early-onset preeclampsia.Proc Natl Acad Sci U S A. 2019 Sep 3;116(36):18109-18118. doi: 10.1073/pnas.1907548116. Epub 2019 Aug 22. Proc Natl Acad Sci U S A. 2019. PMID: 31439814 Free PMC article.
-
Role of the Macrophage Migration Inhibitory Factor in the Pathophysiology of Pre-Eclampsia.Int J Mol Sci. 2021 Feb 12;22(4):1823. doi: 10.3390/ijms22041823. Int J Mol Sci. 2021. PMID: 33673075 Free PMC article. Review.
-
Global DNA methylation in placental tissues from pregnant with preeclampsia: A systematic review and pathway analysis.Placenta. 2020 Nov;101:97-107. doi: 10.1016/j.placenta.2020.09.004. Epub 2020 Sep 7. Placenta. 2020. PMID: 32942147
Cited by
-
[Pathoanatomical and clinical aspects of the placenta in preterm birth].Pathologe. 2017 Jul;38(4):248-259. doi: 10.1007/s00292-016-0156-x. Pathologe. 2017. PMID: 27255227 Review. German.
-
Integrated Systems Biology Approach Identifies Novel Maternal and Placental Pathways of Preeclampsia.Front Immunol. 2018 Aug 8;9:1661. doi: 10.3389/fimmu.2018.01661. eCollection 2018. Front Immunol. 2018. PMID: 30135684 Free PMC article.
-
Endoplasmic Reticulum Stress and Homeostasis in Reproductive Physiology and Pathology.Int J Mol Sci. 2017 Apr 8;18(4):792. doi: 10.3390/ijms18040792. Int J Mol Sci. 2017. PMID: 28397763 Free PMC article. Review.
-
Bioinformatics-based identification of miRNA-, lncRNA-, and mRNA-associated ceRNA networks and potential biomarkers for preeclampsia.Medicine (Baltimore). 2020 Nov 6;99(45):e22985. doi: 10.1097/MD.0000000000022985. Medicine (Baltimore). 2020. PMID: 33157942 Free PMC article.
-
MicroRNA-322 overexpression reduces neural tube defects in diabetic pregnancies.Am J Obstet Gynecol. 2024 Feb;230(2):254.e1-254.e13. doi: 10.1016/j.ajog.2023.07.048. Epub 2023 Jul 31. Am J Obstet Gynecol. 2024. PMID: 37531989 Free PMC article.
References
-
- Lain KY, Roberts JM. Contemporary concepts of the pathogenesis and management of preeclampsia. J Am Med Assoc. 2002;287:3183–3186. - PubMed
-
- Ohkuchi A, Hirashima C, Matsubara S. Alterations in placental growth factor levels before and after the onset of preeclampsia are more pronounced in women with early onset severe preeclampsia. Hypertens Res. 2007;30:151–159. - PubMed
-
- Wikstrom AK, Nash P, Eriksson UJ. Evidence of increased oxidative stress and a change in the plasminogen activator inhibitor (PAI)-1 to PAI-2 ratio in early-onset but not late-onset preeclampsia. Am J Obstet Gynecol. 2009;201(597):e591–598. - PubMed
-
- von Dadelszen P, Magee LA, Roberts JM. Subclassification of preeclampsia. Hypertens Pregn. 2003;22:143–148. - PubMed
-
- Myatt L, Redman CW, Staff AC. Strategy for standardization of preeclampsia research study design. Hypertension. 2014;63:1293–1301. - PubMed
Publication types
MeSH terms
Substances
Grants and funding
LinkOut - more resources
Full Text Sources
Other Literature Sources
Miscellaneous
