Randomized Controlled Trial
. 2014 Jul 24;371(4):313-325.
doi: 10.1056/NEJMoa1314474. Epub 2014 Jun 15.

Outpatient glycemic control with a bionic pancreas in type 1 diabetes

Affiliations
Randomized Controlled Trial

Outpatient glycemic control with a bionic pancreas in type 1 diabetes

Steven J Russell et al. N Engl J Med. .

Abstract

Background: The safety and effectiveness of automated glycemic management have not been tested in multiday studies under unrestricted outpatient conditions.

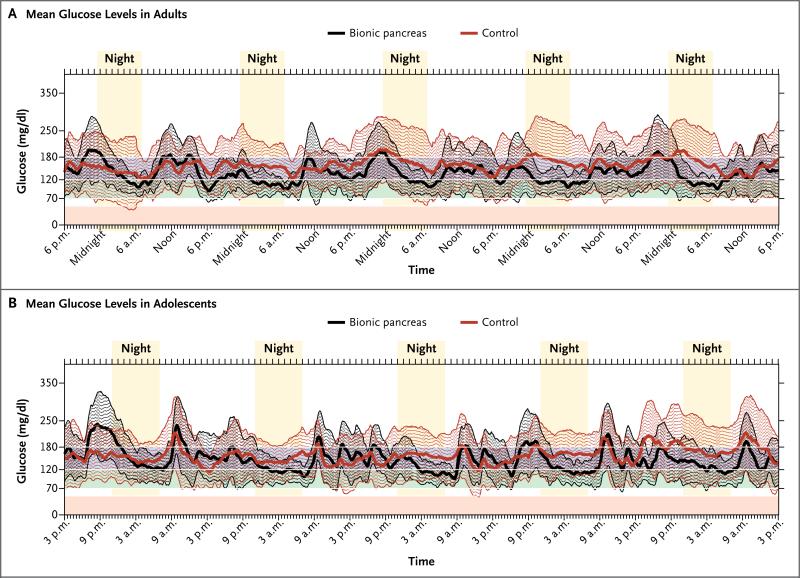
Methods: In two random-order, crossover studies with similar but distinct designs, we compared glycemic control with a wearable, bihormonal, automated, "bionic" pancreas (bionic-pancreas period) with glycemic control with an insulin pump (control period) for 5 days in 20 adults and 32 adolescents with type 1 diabetes mellitus. The automatically adaptive algorithm of the bionic pancreas received data from a continuous glucose monitor to control subcutaneous delivery of insulin and glucagon.

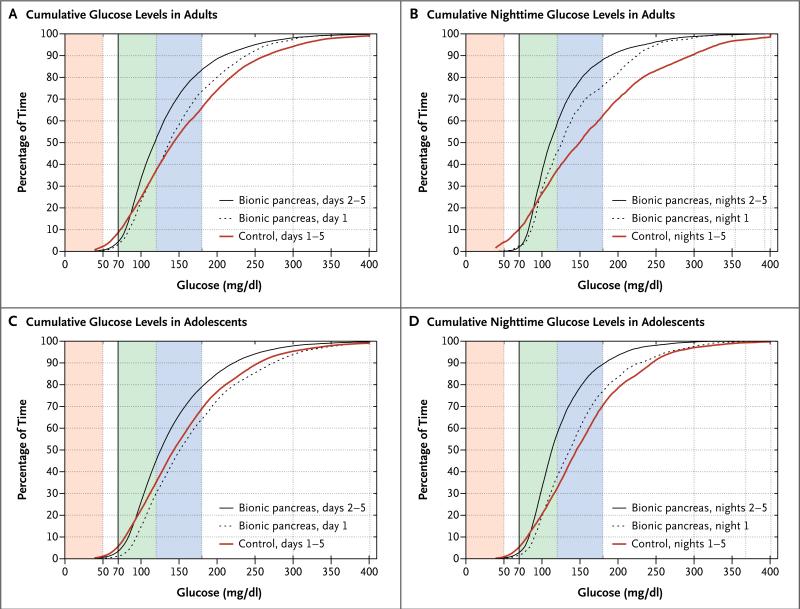
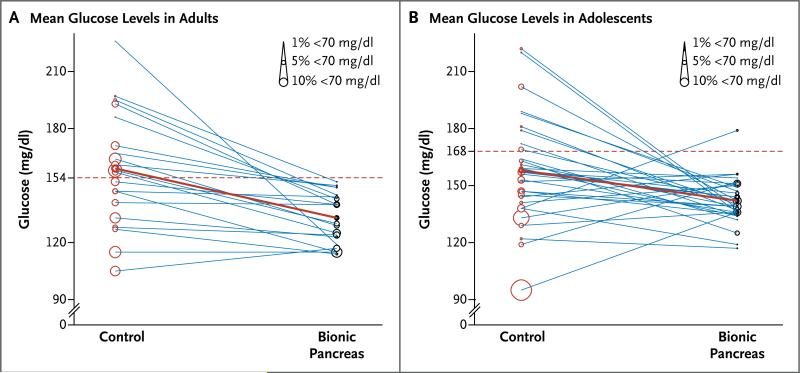
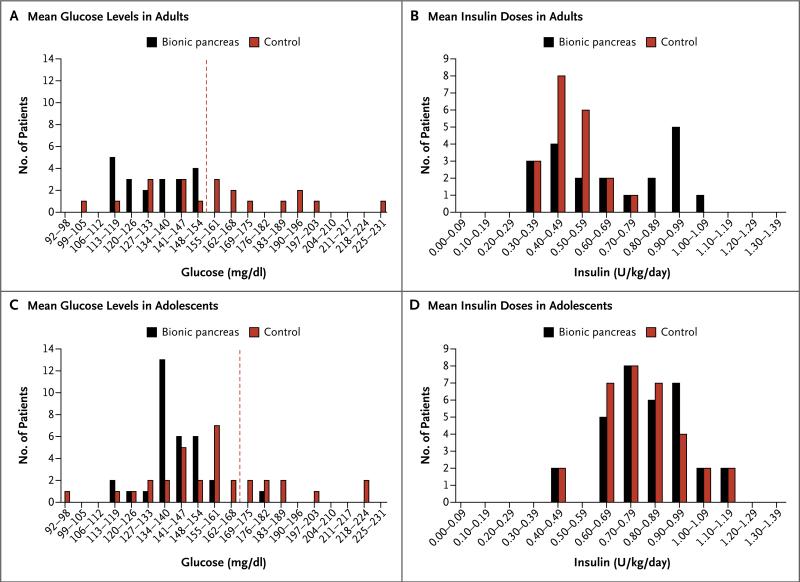
Results: Among the adults, the mean plasma glucose level over the 5-day bionic-pancreas period was 138 mg per deciliter (7.7 mmol per liter), and the mean percentage of time with a low glucose level (<70 mg per deciliter [3.9 mmol per liter]) was 4.8%. After 1 day of automatic adaptation by the bionic pancreas, the mean (±SD) glucose level on continuous monitoring was lower than the mean level during the control period (133±13 vs. 159±30 mg per deciliter [7.4±0.7 vs. 8.8±1.7 mmol per liter], P<0.001) and the percentage of time with a low glucose reading was lower (4.1% vs. 7.3%, P=0.01). Among the adolescents, the mean plasma glucose level was also lower during the bionic-pancreas period than during the control period (138±18 vs. 157±27 mg per deciliter [7.7±1.0 vs. 8.7±1.5 mmol per liter], P=0.004), but the percentage of time with a low plasma glucose reading was similar during the two periods (6.1% and 7.6%, respectively; P=0.23). The mean frequency of interventions for hypoglycemia among the adolescents was lower during the bionic-pancreas period than during the control period (one per 1.6 days vs. one per 0.8 days, P<0.001).

Conclusions: As compared with an insulin pump, a wearable, automated, bihormonal, bionic pancreas improved mean glycemic levels, with less frequent hypoglycemic episodes, among both adults and adolescents with type 1 diabetes mellitus. (Funded by the National Institute of Diabetes and Digestive and Kidney Diseases and others; ClinicalTrials.gov numbers, NCT01762059 and NCT01833988.).


Figures

Figure 1
Figure 1. Variation in the Mean Glucose Level among Adults and Adolescents
Panel A shows the superimposition of tracings of mean glucose levels on continuous monitoring at all 5-minute steps during the 5-day period in all 20 patients in the adult study during the period when they were wearing the bionic pancreas (black) and during the control period (red). Each tracing is surrounded by an envelope (of corresponding color) that spans 1 SD in either direction around the mean glucose level at each 5-minute step. The mean glucose level during the bionic-pancreas period was 137 mg per deciliter, as compared with 158 mg per deciliter during the control period. Panel B shows tracings for the 32 patients in the adolescent study. The mean glucose level during the bionic-pancreas period was 147 mg per deciliter, as compared with 158 mg per deciliter during the control period. The shaded areas at the bottom of the two panels show clinically significant levels of glucose, including less than 50 mg per deciliter, indicating hypoglycemia (pink); 70 to 120 mg per deciliter, indicating good control (green); and 121 to 180 mg per deciliter, indicating mild hyperglycemia (blue between white lines). To convert the values for glucose to millimoles per liter, multiply by 0.05551.
Figure 2
Figure 2. Cumulative Glucose Levels among Adults and Adolescents
Panel A shows cumulative glucose levels on continuous monitoring during the bionic-pancreas period (day 1 and days 2 through 5) and during the 5-day control period in the 20 patients in the adult study. (During the first 24 hours of the study, the bionic pancreas automatically underwent most of its adaptation.) Panel B shows cumulative nighttime glucose levels in adults. Panels C and D show analogous results for the 32 patients in the adolescent study. In all panels, the shaded regions correspond to a glucose level of less than 50 mg per deciliter (pink), 70 to 120 mg per deciliter (green), and 121 to 180 mg per deciliter (blue). To convert the values for glucose to milli-moles per liter, multiply by 0.05551.
Figure 3
Figure 3. Distributions of Mean Glucose Levels and Hypoglycemia among Adults and Adolescents
Panel A shows the mean glucose level in each adult on days 2 through 5 of the control period (red circles), which is connected to the corresponding mean glucose level during the bionic-pancreas period (black circles). The diameter of each circle is proportional to the percentage of time that the patient spent with a low glucose value (<70 mg per deciliter) on days 2 through 5. The dashed red line indicates a mean glucose threshold of 154 mg per deciliter, which corresponds to a glycated hemoglobin level of 7%, the upper limit of the therapeutic goal for adults as outlined by the American Diabetes Association. This goal was met in all patients during the bionic-pancreas period. Panel B shows a similar distribution for each of the adolescents, with a cutoff point for the mean glucose level of 168 mg per deci liter, which corresponds to a glycated hemoglobin level of 7.5%, as recommended for adolescents. The one patient in whom this level was not reached on days 2 through 5 had a mean glucose level of 148 mg per deciliter on days 3 through 5. In the two panels, the solid red line indicates the mean for all the patients in the study group. To convert the values for glucose to millimoles per liter, multiply by 0.05551.
Figure 4
Figure 4. Histogram Distributions of Mean Glucose Levels and Insulin Doses among Adults and Adolescents
Panel A shows a histogram distribution of the mean glucose levels on continuous monitoring in adults during the bionic-pancreas period and the control period. The distribution shows the number of patients with mean glucose levels divided into intervals of 7 mg per deci-liter on days 2 through 5. The dashed red line indicates a mean glucose level of 154 mg per deciliter, which corresponds to a glycated hemoglobin level of 7%. Panel B shows a similar histogram distribution of total daily doses of insulin in the adults, divided into intervals of 0.1 U per kilogram of body weight per day. Panels C and D show similar histogram distributions for the adolescents, with a cutoff point for the mean glucose level of 168 mg of glucose per deciliter, which corresponds to a glycated hemoglobin level of 7.5%. To convert the values for glucose to millimoles per liter, multiply by 0.05551.

References

    1. The Diabetes Control and Complications Trial Research Group The effect of intensive treatment of diabetes on the development and progression of long-term complications in insulin-dependent diabetes mellitus. N Engl J Med. 1993;329:977–86. - PubMed
    1. Writing Team for the Diabetes Control and Complications Trial–Epidemiology of Diabetes Interventions and Complications Research Group Effect of intensive therapy on the microvascular complications of type 1 diabetes mellitus. JAMA. 2002;287:2563–9. - PMC - PubMed
    1. Nathan DM, Cleary PA, Backlund JY, et al. Intensive diabetes treatment and cardiovascular disease in patients with type 1 diabetes. N Engl J Med. 2005;353:2643–53. - PMC - PubMed
    1. Petitti DB, Klingensmith GJ, Bell RA, et al. Glycemic control in youth with diabetes: the SEARCH for Diabetes in Youth Study. J Pediatr. 2009;155:668–72. - PMC - PubMed
    1. Beck RW, Tamborlane WV, Bergenstal RM, Miller KM, DuBose SN, Hall CA. The T1D Exchange clinic registry. J Clin Endocrinol Metab. 2012;97:4383–9. - PubMed

Publication types

MeSH terms

Associated data