

GRASP: analysis of genotype-phenotype results from 1390 genome-wide association studies and corresponding open access database
- PMID: 24931982
- PMCID: PMC4072913
- DOI: 10.1093/bioinformatics/btu273
GRASP: analysis of genotype-phenotype results from 1390 genome-wide association studies and corresponding open access database
Abstract
Summary: We created a deeply extracted and annotated database of genome-wide association studies (GWAS) results. GRASP v1.0 contains >6.2 million SNP-phenotype association from among 1390 GWAS studies. We re-annotated GWAS results with 16 annotation sources including some rarely compared to GWAS results (e.g. RNAediting sites, lincRNAs, PTMs).
Motivation: To create a high-quality resource to facilitate further use and interpretation of human GWAS results in order to address important scientific questions.
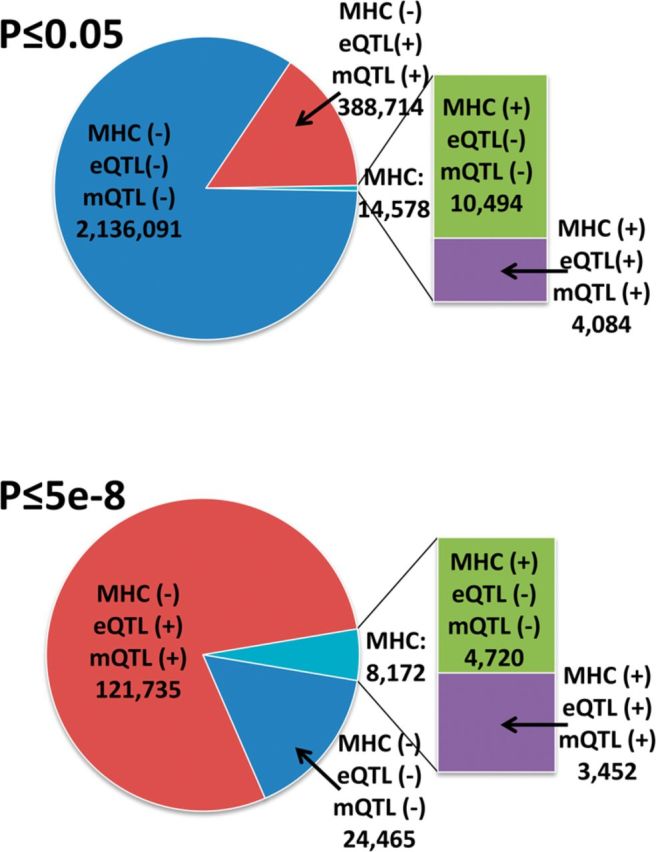
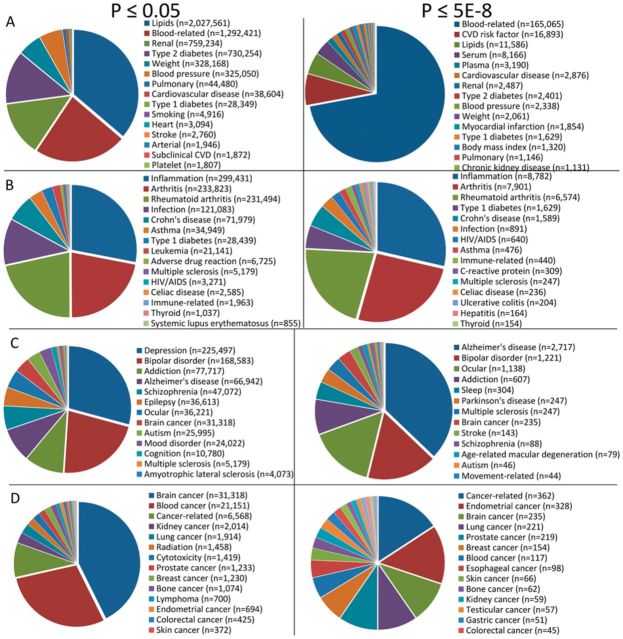
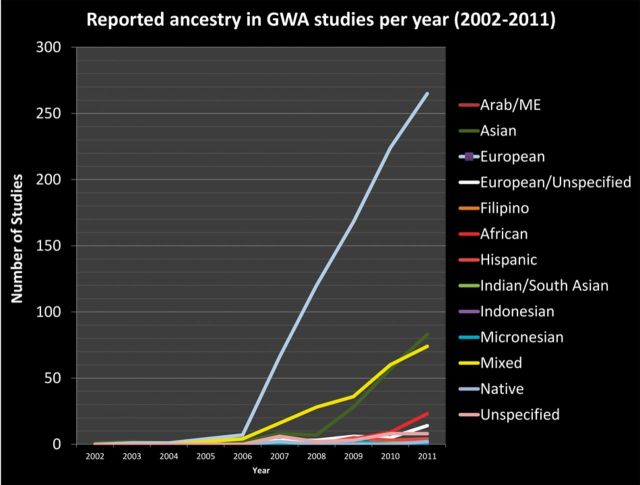
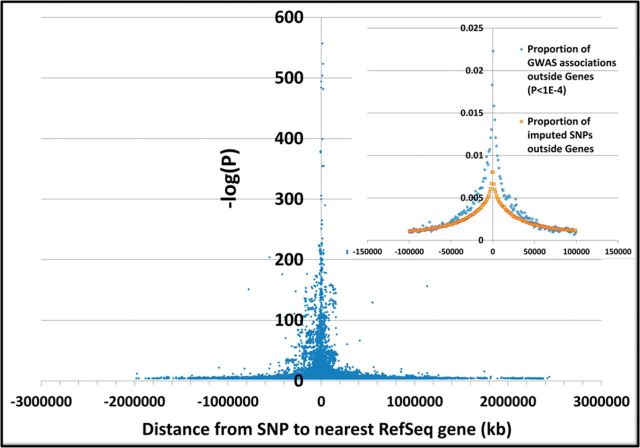
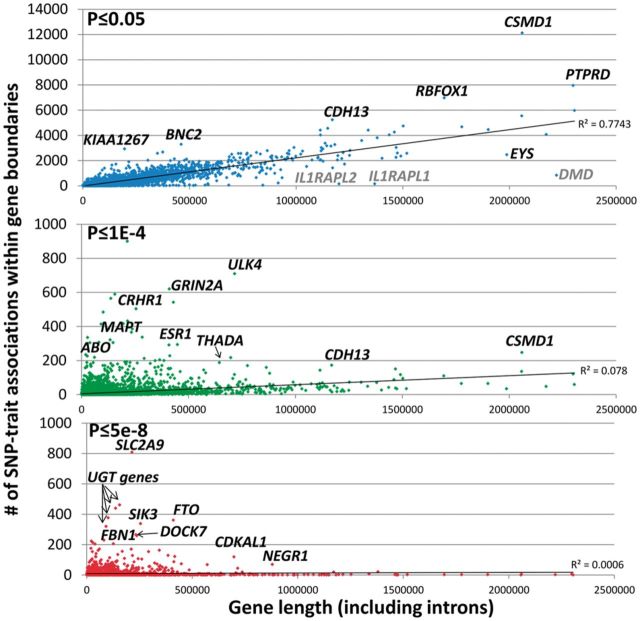
Results: GWAS have grown exponentially, with increases in sample sizes and markers tested, and continuing bias toward European ancestry samples. GRASP contains >100 000 phenotypes, roughly: eQTLs (71.5%), metabolite QTLs (21.2%), methylation QTLs (4.4%) and diseases, biomarkers and other traits (2.8%). cis-eQTLs, meQTLs, mQTLs and MHC region SNPs are highly enriched among significant results. After removing these categories, GRASP still contains a greater proportion of studies and results than comparable GWAS catalogs. Cardiovascular disease and related risk factors pre-dominate remaining GWAS results, followed by immunological, neurological and cancer traits. Significant results in GWAS display a highly gene-centric tendency. Sex chromosome X (OR = 0.18[0.16-0.20]) and Y (OR = 0.003[0.001-0.01]) genes are depleted for GWAS results. Gene length is correlated with GWAS results at nominal significance (P ≤ 0.05) levels. We show this gene-length correlation decays at increasingly more stringent P-value thresholds. Potential pleotropic genes and SNPs enriched for multi-phenotype association in GWAS are identified. However, we note possible population stratification at some of these loci. Finally, via re-annotation we identify compelling functional hypotheses at GWAS loci, in some cases unrealized in studies to date.
Conclusion: Pooling summary-level GWAS results and re-annotating with bioinformatics predictions and molecular features provides a good platform for new insights.
Availability: The GRASP database is available at http://apps.nhlbi.nih.gov/grasp.
Published by Oxford University Press 2014. This work is written by US Government employees and is in the public domain in the US.
Figures
Similar articles
-
e-GRASP: an integrated evolutionary and GRASP resource for exploring disease associations.BMC Genomics. 2016 Oct 17;17(Suppl 9):770. doi: 10.1186/s12864-016-3088-1. BMC Genomics. 2016. PMID: 27766955 Free PMC article.
-
GRASP v2.0: an update on the Genome-Wide Repository of Associations between SNPs and phenotypes.Nucleic Acids Res. 2015 Jan;43(Database issue):D799-804. doi: 10.1093/nar/gku1202. Epub 2014 Nov 26. Nucleic Acids Res. 2015. PMID: 25428361 Free PMC article.
-
Synthesis of 53 tissue and cell line expression QTL datasets reveals master eQTLs.BMC Genomics. 2014 Jun 27;15(1):532. doi: 10.1186/1471-2164-15-532. BMC Genomics. 2014. PMID: 24973796 Free PMC article.
-
Sources of bias in genomics research of oral and dental traits.Community Dent Health. 2020 Feb 27;37(1):102-106. doi: 10.1922/CDH_SpecialIssue_Divaris05. Community Dent Health. 2020. PMID: 32031351 Free PMC article. Review.
-
Genome-wide association studies: applications and insights gained in Ophthalmology.Eye (Lond). 2014 Sep;28(9):1066-79. doi: 10.1038/eye.2014.145. Epub 2014 Jun 27. Eye (Lond). 2014. PMID: 24971990 Free PMC article. Review.
Cited by
-
Variants within the SP110 nuclear body protein modify risk of canine degenerative myelopathy.Proc Natl Acad Sci U S A. 2016 May 31;113(22):E3091-100. doi: 10.1073/pnas.1600084113. Epub 2016 May 16. Proc Natl Acad Sci U S A. 2016. PMID: 27185954 Free PMC article.
-
Genome-wide association study for circulating fibroblast growth factor 21 and 23.Sci Rep. 2020 Sep 3;10(1):14578. doi: 10.1038/s41598-020-71569-8. Sci Rep. 2020. PMID: 32884031 Free PMC article.
-
Identifying Liver Cancer-Related Enhancer SNPs by Integrating GWAS and Histone Modification ChIP-seq Data.Biomed Res Int. 2016;2016:2395341. doi: 10.1155/2016/2395341. Epub 2016 Jun 27. Biomed Res Int. 2016. PMID: 27429976 Free PMC article.
-
Identification of polymorphisms in cancer patients that differentially affect survival with age.Aging (Albany NY). 2017 Oct 20;9(10):2117-2136. doi: 10.18632/aging.101305. Aging (Albany NY). 2017. PMID: 29064820 Free PMC article.
-
Exploring genetic associations with ceRNA regulation in the human genome.Nucleic Acids Res. 2017 Jun 2;45(10):5653-5665. doi: 10.1093/nar/gkx331. Nucleic Acids Res. 2017. PMID: 28472449 Free PMC article.
References
-
- Broer L, et al. Distinguishing true from false positives in genomic studies: p values. Eur. J. Epidemiol. 2013;28:131–138. - PubMed
Publication types
MeSH terms
Grants and funding
LinkOut - more resources
Full Text Sources
Other Literature Sources
Research Materials
Miscellaneous
