. 2014 Jun 15;30(12):i246-i254.
doi: 10.1093/bioinformatics/btu287.

Gene network inference by probabilistic scoring of relationships from a factorized model of interactions

Affiliations

Gene network inference by probabilistic scoring of relationships from a factorized model of interactions

Marinka Zitnik et al. Bioinformatics. .

Abstract

Motivation: Epistasis analysis is an essential tool of classical genetics for inferring the order of function of genes in a common pathway. Typically, it considers single and double mutant phenotypes and for a pair of genes observes whether a change in the first gene masks the effects of the mutation in the second gene. Despite the recent emergence of biotechnology techniques that can provide gene interaction data on a large, possibly genomic scale, few methods are available for quantitative epistasis analysis and epistasis-based network reconstruction.

Results: We here propose a conceptually new probabilistic approach to gene network inference from quantitative interaction data. The approach is founded on epistasis analysis. Its features are joint treatment of the mutant phenotype data with a factorized model and probabilistic scoring of pairwise gene relationships that are inferred from the latent gene representation. The resulting gene network is assembled from scored pairwise relationships. In an experimental study, we show that the proposed approach can accurately reconstruct several known pathways and that it surpasses the accuracy of current approaches.

Availability and implementation: Source code is available at http://github.com/biolab/red.


Figures

Fig. 1.
Fig. 1.
A hypothetical example of epistasis analysis with three genes, u, v and w. Nodes in the central graph represent mutant phenotypes. The phenotypic difference between a double knockout [e.g. R(uΔvΔ)] and a single knockout mutant [e.g. R(vΔ)] is represented with the length of the corresponding dotted edge. Expected double mutant phenotypes, which assume no interaction between genes (see also Section 2.1), are denoted with E [e.g. E(uΔvΔ)]. A double mutant uΔvΔ (a) has a phenotype similar to that of a single mutant vΔ, which indicates that v is epistatic to u. From the activity of genes v and w (b) we conjecture that gene v partially depends on gene w, i.e. v also acts through a separate pathway because their double mutant vΔwΔ has a phenotype that is equally similar to the single knockout R(wΔ) and the expected phenotype E(vΔwΔ). The phenotype of double knockout uΔwΔ (c) is close to the expected phenotype of uΔwΔ, E(uΔwΔ), which may be explained by u and w acting independently in parallel pathways. Gene ordering from these three relations is preserved in the joint network (d), which is a candidate pathway of genes u, v and w
Fig. 2.
Fig. 2.
An overview of Réd, a novel approach for automatic gene network inference from mutant data. Inputs to the preferential order-of-action factorized algorithm of Réd include a matrix of double knockout phenotypes (G), a vector of single knockout phenotypes (S) and a matrix of expected phenotypes corresponding to the assumption of absent interactions between genes (H). Réd estimates a factorized model from G, whose gene latent feature vectors capture the global structure of the phenotype landscape, and learns a parametrized logistic map Ψ, which is a gene-dependent non-linear mapping from latent to phenotype space. A scoring scheme is then applied to the inferred model to estimate the probabilities of pairwise gene relationships of different types. Finally, a multi-gene network is reconstructed, which aims to minimize the number of violating and redundant edges
Fig. 3.
Fig. 3.
Illustration of violating (a) and redundant (b) edges (in gray) in a pathway with four genes. Edge y1v1 is violating because there is evidence that v1 is placed upstream of y1 (v1w1 and w1y1) but also that y1 is upstream of v1 (y1v1). Edge u2w2 is redundant because there is evidence of an intermediate gene v2. Similarly, edge u2y2 is redundant because of two intervening genes, v2 and w2
Fig. 4.
Fig. 4.
Gene network of the N-linked glycosylation pathway inferred by Réd. For reference, we show the true ordering of this pathway (Helenius and Aebi, 2004) as adapted from Battle et al. (2010). The inferred gene network reflects many correct gene placements
Fig. 5.
Fig. 5.
Gene networks of the phosphatidylserine to PC conversion pathway (a) and the Kennedy pathway (b) as inferred by Réd. For reference, we show the true orderings in both pathways adapted from Surma et al. (2013). Réd correctly and with high confidence (P>0.80) inferred all three pairwise gene relationships of the PC conversion pathway. It also correctly predicted two out of three gene relationships of the Kennedy pathway with the wrong prediction (PCT1 → CKI1) being assigned a low confidence (P=0.25)
Fig. 6.
Fig. 6.
The ERAD pathway predicted by Réd is shown by solid edges. Placement of genes in the inferred network is consistent with known interdependencies (dotted edges)
Fig. 7.
Fig. 7.
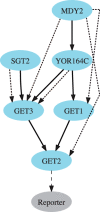
Gene network inferred by Réd that represents the likely ordering of genes belonging to the TA protein biogenesis machinery (solid edges). Known relationships between genes are denoted by dotted edges. Note that the predicted ordering strongly reflects known interdependencies between genes

Similar articles

Cited by

References

    1. Ahn J, et al. Integrative gene network construction for predicting a set of complementary prostate cancer genes. Bioinformatics. 2011;27:1846–1853. - PubMed
    1. Avery L, Wasserman S. Ordering gene function: the interpretation of epistasis in regulatory hierarchies. Trends Genet. 1992;8:312–316. - PMC - PubMed
    1. Battle A, et al. Automated identification of pathways from quantitative genetic interaction data. Mol. Sys. Biol. 2010;6:379. - PMC - PubMed
    1. Beerenwinkel N, et al. Analysis of epistatic interactions and fitness landscapes using a new geometric approach. BMC Evol. Biol. 2007;7:6. - PMC - PubMed
    1. Botstein D, Maurer R. Genetic approaches to the analysis of microbial development. Annu. Rev. Genet. 1982;16:61–83. - PubMed

Publication types

Substances