

Understanding cultivar-specificity and soil determinants of the cannabis microbiome
- PMID: 24932479
- PMCID: PMC4059704
- DOI: 10.1371/journal.pone.0099641
Understanding cultivar-specificity and soil determinants of the cannabis microbiome
Erratum in
- PLoS One. 2014;9(9):e107415. Hartsel, Josh [corrected to Hartsel, Joshua A]
Abstract
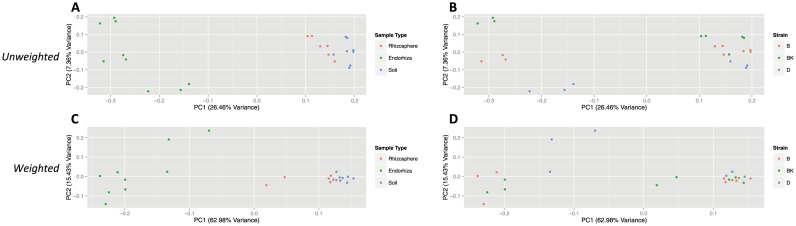
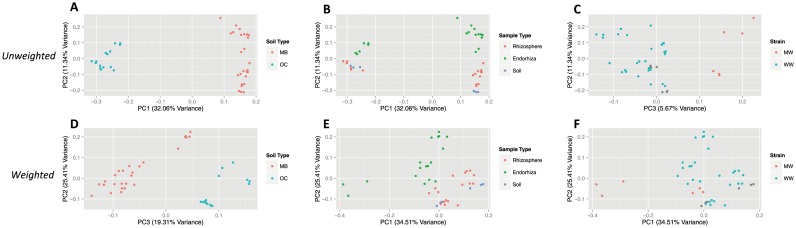
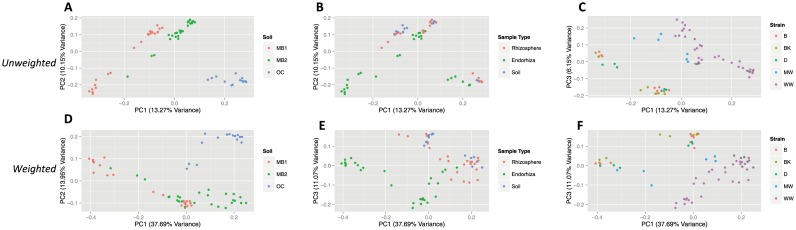
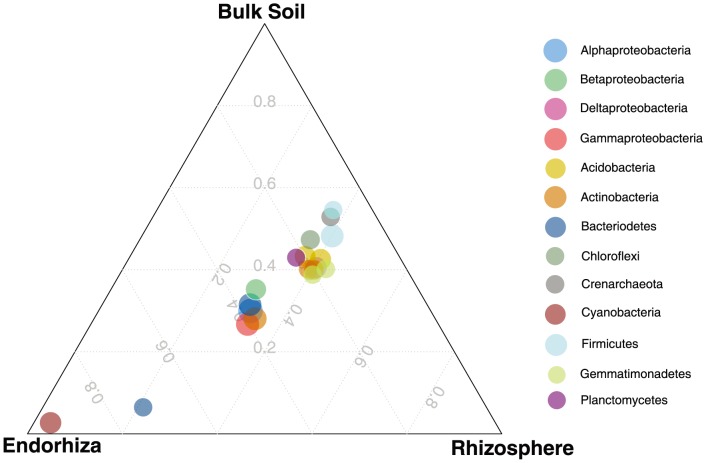
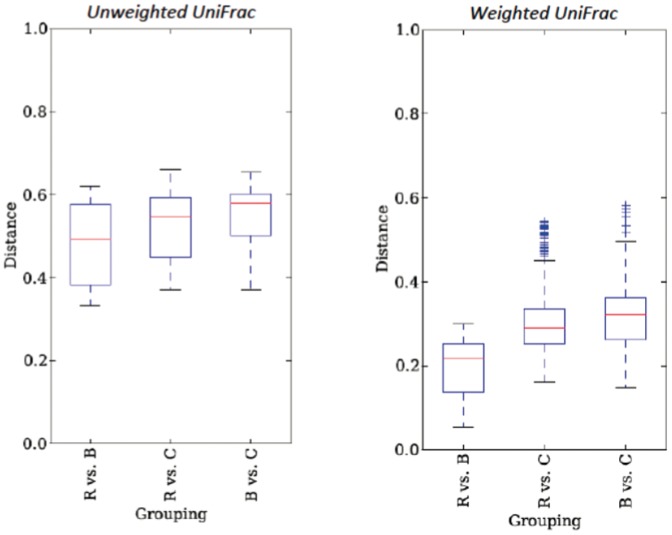
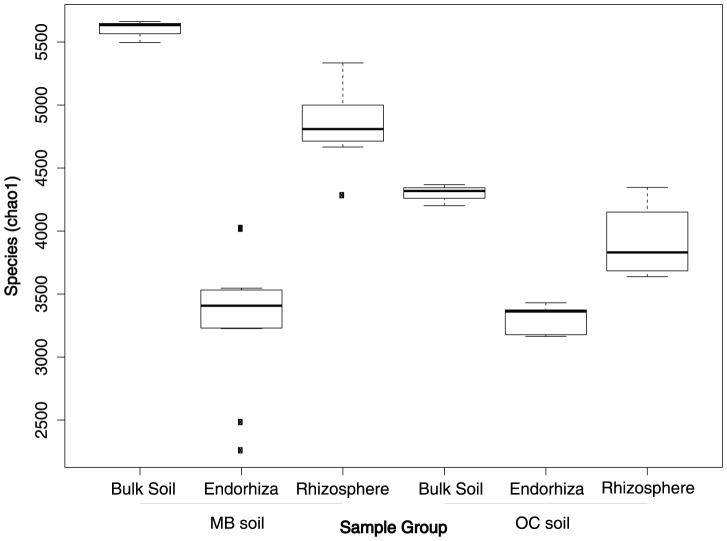
Understanding microbial partnerships with the medicinally and economically important crop Cannabis has the potential to affect agricultural practice by improving plant fitness and production yield. Furthermore, Cannabis presents an interesting model to explore plant-microbiome interactions as it produces numerous secondary metabolic compounds. Here we present the first description of the endorhiza-, rhizosphere-, and bulk soil-associated microbiome of five distinct Cannabis cultivars. Bacterial communities of the endorhiza showed significant cultivar-specificity. When controlling cultivar and soil type the microbial community structure was significantly different between plant cultivars, soil types, and between the endorhiza, rhizosphere and soil. The influence of soil type, plant cultivar and sample type differentiation on the microbial community structure provides support for a previously published two-tier selection model, whereby community composition across sample types is determined mainly by soil type, while community structure within endorhiza samples is determined mainly by host cultivar.
Conflict of interest statement
Figures
Similar articles
-
Association between host nitrogen absorption and root-associated microbial community in field-grown wheat.Appl Microbiol Biotechnol. 2023 Dec;107(23):7347-7364. doi: 10.1007/s00253-023-12787-8. Epub 2023 Sep 25. Appl Microbiol Biotechnol. 2023. PMID: 37747613
-
Local Network Properties of Soil and Rhizosphere Microbial Communities in Potato Plantations Treated with a Biological Product Are Important Predictors of Crop Yield.mSphere. 2021 Aug 25;6(4):e0013021. doi: 10.1128/mSphere.00130-21. Epub 2021 Aug 11. mSphere. 2021. PMID: 34378980 Free PMC article.
-
Soil indigenous microbiome and plant genotypes cooperatively modify soybean rhizosphere microbiome assembly.BMC Microbiol. 2019 Sep 2;19(1):201. doi: 10.1186/s12866-019-1572-x. BMC Microbiol. 2019. PMID: 31477026 Free PMC article.
-
Advances in Soil Engineering: Sustainable Strategies for Rhizosphere and Bulk Soil Microbiome Enrichment.Front Biosci (Landmark Ed). 2022 Jun 16;27(6):195. doi: 10.31083/j.fbl2706195. Front Biosci (Landmark Ed). 2022. PMID: 35748271 Review.
-
Harnessing microbial multitrophic interactions for rhizosphere microbiome engineering.Microbiol Res. 2022 Dec;265:127199. doi: 10.1016/j.micres.2022.127199. Epub 2022 Sep 15. Microbiol Res. 2022. PMID: 36137486 Review.
Cited by
-
Profiling, isolation and characterisation of beneficial microbes from the seed microbiomes of drought tolerant wheat.Sci Rep. 2021 Jun 7;11(1):11916. doi: 10.1038/s41598-021-91351-8. Sci Rep. 2021. PMID: 34099781 Free PMC article.
-
Land Management and Microbial Seed Load Effect on Rhizosphere and Endosphere Bacterial Community Assembly in Wheat.Front Microbiol. 2019 Nov 15;10:2625. doi: 10.3389/fmicb.2019.02625. eCollection 2019. Front Microbiol. 2019. PMID: 31803160 Free PMC article.
-
Scientific Prospects for Cannabis-Microbiome Research to Ensure Quality and Safety of Products.Microorganisms. 2020 Feb 20;8(2):290. doi: 10.3390/microorganisms8020290. Microorganisms. 2020. PMID: 32093340 Free PMC article. Review.
-
redbiom: a Rapid Sample Discovery and Feature Characterization System.mSystems. 2019 Jun 25;4(4):e00215-19. doi: 10.1128/mSystems.00215-19. mSystems. 2019. PMID: 31239397 Free PMC article.
-
The Macleaya cordata Symbiont: Revealing the Effects of Plant Niches and Alkaloids on the Bacterial Community.Front Microbiol. 2021 Jun 9;12:681210. doi: 10.3389/fmicb.2021.681210. eCollection 2021. Front Microbiol. 2021. PMID: 34177865 Free PMC article.
References
-
- Swift MJ, Izac MN, van Noordwijk M (2004) Biodiversity and ecosystem services in agricultural landscapes—are we asking the right questions? Agricult Ecosys Environ 104: 113–134.
-
- Mendes R, Kruijt M, de Bruijn I, Dekkers E, van der Voort M, et al. (2011) Deciphering the rhizosphere microbiome for disease-suppressive bacteria. Science 332: 1097–100. - PubMed
-
- Doornbos RF, Loon LCV, Bakker PAHM (2011) Impact of induced systemic resistance on the bacterial microbiome of Arabidopsis thaliana. Multitrophic Interactions in Soil 71: 169–172.
-
- Berendsen RL, Pieterse CMJ, Bakker PHM (2012) The rhizosphere microbiome and plant health. Trends Plant Sci 1–9. - PubMed
-
- Whipps JM (2001) Microbial interactions and biocontrol in the rhizosphere. J Exp Bot 52: 487–511. - PubMed
Publication types
MeSH terms
Substances
Grants and funding
LinkOut - more resources
Full Text Sources
Other Literature Sources
