. 2014 Jun 16;9(6):e99652.
doi: 10.1371/journal.pone.0099652. eCollection 2014.

Stimulatory interactions between human coronary smooth muscle cells and dendritic cells

Affiliations

Stimulatory interactions between human coronary smooth muscle cells and dendritic cells

Sara Paccosi et al. PLoS One. .

Abstract

Despite inflammatory and immune mechanisms participating to atherogenesis and dendritic cells (DCs) driving immune and non-immune tissue injury response, the interactions between DCs and vascular smooth muscle cells (VSMCs) possibly relevant to vascular pathology including atherogenesis are still unclear. To address this issue, immature DCs (iDCs) generated from CD14+ cells isolated from healthy donors were matured either with cytokines (mDCs), or co-cultured (ccDCs) with human coronary artery VSMCs (CASMCs) using transwell chambers. Co-culture induced DC immunophenotypical and functional maturation similar to cytokines, as demonstrated by flow cytometry and mixed lymphocyte reaction. In turn, factors from mDCs and ccDCs induced CASMC migration. MCP-1 and TNFα, secreted from DCs, and IL-6 and MCP-1, secreted from CASMCs, were primarily involved. mDCs adhesion to CASMCs was enhanced by CASMC pre-treatment with IFNγ and TNFα ICAM-1 and VCAM-1 were involved, since the expression of specific mRNAs for these molecules increased and adhesion was inhibited by neutralizing antibodies to the counter-receptors CD11c and CD18. Adhesion was also inhibited by CASMC pre-treatment with the HMG-CoA-reductase inhibitor atorvastatin and the PPARγ agonist rosiglitazone, which suggests a further mechanism for the anti-inflammatory action of these drugs. Adhesion of DCs to VSMCs was shown also in vivo in rat carotid 7 to 21 days after crush and incision injury. The findings indicate that DCs and VSMCs can interact with reciprocal stimulation, possibly leading to perpetuate inflammation and vascular wall remodelling, and that the interaction is enhanced by a cytokine-rich inflammatory environment and down-regulated by HMGCoA-reductase inhibitors and PPARγ agonists.


Conflict of interest statement

Competing Interests: The authors have declared that no competing interests exist.

Figures

Figure 1
Figure 1. Immunophenotypical and functional maturation of DCs.
A) Flow cytometry for DC markers in immature DCs (iDCs), DCs matured with a standard protocol (mDCs), DCs co-cultured with CASMCs (ccDCs) and DC co-cultured with CASMC pre-treated with 50 ng/mL TNFα and IFNγ (ccDCs + cytokines); all co-cultures were inside transwells. Mean ±SE of median fluorescence intensity (MFI), n = 12; *P<0.05 vs. iDC, ANOVA. B) Proliferation of lymphocyte alone (0) and in mixed reaction with iDCs, mDCs, ccDC or ccDCs + cytokines. Lymphocyte proliferation is expressed as mean ±SE of counts-per-minute/well (cpm/well; 4 experiments, each in triplicate); *P<0.05 vs. iDCs, ANOVA. C) IL-6, MCP-1, IL-1β and TNFα release from CASMC, iDCs, mDCs, ccDCs as assayed by Milliplex method. Atorvastatin (ator; 1 µmol/L) and rosiglitazone (rosig; 20 µmol/L) did not influence the release of cytokines in co-cultures. The release of cytokines was measured from 1×10⁶ cells DCs and 5×10⁴ CASMCs. Results are expressed as pg/mL. Mean ±SE of 4 experiments. *P<0.05 vs iDC, ANOVA. D) Flow cytometry analysis of DC maturation and of the effect of neutralizing antibodies against TNFα, MCP-1 and IL-6 or of a cocktail of all those antibodies. Representative histograms of ccDCs in the absence (filled histogram) and in the presence of antibodies (open histogram, black lines) are shown. The histogram for the isotype control is included (open histogram, faint line). The effect of non immune IgG is not shown.
Figure 2
Figure 2. Characterization of co-cultured DCs.
A–D) Electron microscopy of DCs matured in transwell culture with CASMC (A, B) or with cytokines (C, D). Asterisks indicate lysosomes; hashes indicate smooth endoplasmic reticulum; arrowheads indicate occasional lipid droplets. Bars  = 2 µm (A, C) or 0.5 µm (B, D). E–H) Phase contrast (E, G) and immunofluorescence microscopy (F, H) for DC-SIGN in immature (iDCs; E, F) and mature DCs (mDCs; G, H). The exposure time was the same for both F and H photomicrographs, to show that the labelling of iDCs was lighter than that of mDCs. Note the labelling on cell extensions, indicating membrane expression of the antigen. Bar  = 30 µm. I) Flow cytometry for DC-SIGN expression in iDCs, mDCs and ccDCs. One representative histograms out of 3 performed is shown. The isotype control is included (open histogram).
Figure 3
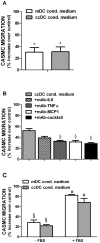
Figure 3. Influence of DCs on CASMC migration.
A) Effect of DC conditioned media on CASMC migration. CASMCs were let to migrate in medium conditioned by mature DCs (mDCs) or by co-cultured DCs (ccDCs). Migration is expressed as percent increase over spontaneous migration of untreated CASMCs (control). Mean ±SE of 4 experiments, each in triplicate. *P<0.05 vs. control CASMCs, Student's t test. B) CASMC migration in response to medium conditioned by co-cultured DCs (ccDCs) in the absence or in the presence of neutralizing monoclonal antibodies against IL-6, (mAb-IL6, 1 µg/mL) TNFα (mAb-TNFα, 1 µg/mL), MCP-1 (mAb-MCP1, 2 µg/mL) or all antibodies together (mAb-cocktail). Migration is expressed as percent increase over untreated CASMCs (control). Mean ±SD of 3 experiments, each in triplicate. §P<0.001 vs. ccDCs, ANOVA. C) Effect of DC conditioned medium with or without FBS on CASMC migration. Migration is expressed as percent increase over spontaneous migration of untreated CASMCs (control). Mean ±SE (N = 16), each in triplicate. §P<0.001 vs unstimulated cells (control); #P<0.01 vs serum-free medium (-FBS) (ANOVA).
Figure 4
Figure 4. Adhesion of mDC to vascular smooth muscle cells.
A) Human mature calcein-labeled DC adhesion to CASMC pre-treated for 12-36 h with 50 ng/mL IFNγ or with 50 ng/mL TNFα. After washing, a suspension of calcein-labeled DCs was added and let to adhere for 45 m. Mean ±SE of 6 experiments, each in triplicate. Results are expressed as percentage of mDC adhesion over that on untreated CASMCs (control). *P<0.05, ANOVA. B, C) Electron microscopy of mDCs adherent to citokyne-treated CASMCs; SMC: smooth muscle cells. Bars = 4 µm (B), or 0.5 µm (C). D-G) Electron microscopy of rat carotid repair tissue (neointima) at 7 (D, E), 14 (F) and 21 d (G) upon crush and incision injury; panel H is an enlargement of the boxed part of panel G. Dendritic cells (D) are seen in contact with smooth muscle cells with secretory phenotype (asterisks). Bar  = 2 µm (D), 500 nm (E), or 1 µm (F, G).
Figure 5
Figure 5. Adhesion molecules and counter-receptors involved in cytokine-induced mDC adhesion to CASMCs.
A) real time RT-PCR of ICAM-1 or VCAM-1 mRNA expression by CASMCs stimulated with TNFα or INFγ (50 ng/mL each cytokine) for 24 h. Data are expressed as fold increase over unstimulated CASMCs. Mean ±SE of 3 experiments. *P<0.05, ***P<0.001 vs. untreated CASMCs, Student's t test. B–D) Effect of neutralizing antibodies on mDC adhesion to CASMCs. CASMCs were untreated (0) or pre-treated with: B) anti-CD11c (0.5 µg/well), C) anti-CD18 (0.5 µg/well), or D) anti-DC-SIGN (0.5 µg/well) neutralizing antibodies. They were pretreated with IFNγ or TNFα for 24 h and then washed before the assay. NI-IgG: non immune IgG. Mean ±SE of 5-7 experiments, each in triplicate. *P<0.05 vs. respective control, Student's t test.
Figure 6
Figure 6. Effects of atorvastatin and rosiglitazone on mDC adhesion to cytokine-stimulated CASMCs.
CASMCs were pre-treated with (A) atorvastatin (0.01–1 µmol/L) or (B) rosiglitazone (1–20 µmol/L) before stimulation with 50 ng/mL TNFα or IFNγ for 24 h followed by assay of DC adhesion as indicated for Figure 4. Mevalonate (300 µM), added to the maximal atorvastatin concentration, reverted statin effect (A). Adhesion is reported as percent of that induced by TNFα or IFNγ (control). Mean ±SE of 6–8 experiments, each in triplicate. *P<0.05 vs. control, ANOVA. (C) Representative experiment of DC to CASMC adhesion. Calcein-labelled mDC were incubated for 45 min with control CASMCs (0) or with CASMCs stimulated with TNFα or IFNγ (50 ng/mL either cytokine) and pre-treated, or not pre-treated, with 1 µmol/L atorvastatin (atorv) or 20 µmol/L rosiglitazone (rosigl). Mevalonate (300 µmol/L) was used to confirm atorvastatin selectivity.

References

    1. Libby P (2002) Inflammation in atherosclerosis. Nature 420: 868–874. - PubMed
    1. Rinaldi B, Romagnoli P, Bacci S, Carnuccio R, Maiuri MC, et al. (2006) Inflammatory events in a vascular remodeling model induced by surgical injury to the rat carotid artery. Br J Pharmacol 147: 175–182. - PMC - PubMed
    1. Weyand CM, Younge BR, Goronzy JJ (2008) T cells in arteritis and atherosclerosis. Curr Opin Lipidol 19: 469–477. - PMC - PubMed
    1. Niessner A, Weyand CM (2010) Dendritic cells in atherosclerotic disease. Clin Immunol 134: 25–32. - PMC - PubMed
    1. Simon DI (2012) Inflammation and vascular injury: basic discovery to drug development. Circ J 76: 1811–1818. - PMC - PubMed

Publication types

MeSH terms