. 2014 Jun 16;9(6):e100165.
doi: 10.1371/journal.pone.0100165. eCollection 2014.

Insulin-like growth factor 2 silencing restores taxol sensitivity in drug resistant ovarian cancer

Affiliations

Insulin-like growth factor 2 silencing restores taxol sensitivity in drug resistant ovarian cancer

Jurriaan Brouwer-Visser et al. PLoS One. .

Abstract

Drug resistance is an obstacle to the effective treatment of ovarian cancer. We and others have shown that the insulin-like growth factor (IGF) signaling pathway is a novel potential target to overcome drug resistance. The purpose of this study was to validate IGF2 as a potential therapeutic target in drug resistant ovarian cancer and to determine the efficacy of targeting IGF2 in vivo. An analysis of The Cancer Genome Atlas (TCGA) data in the serous ovarian cancer cohort showed that high IGF2 mRNA expression is significantly associated with shortened interval to disease progression and death, clinical indicators of drug resistance. In a genetically diverse panel of ovarian cancer cell lines, the IGF2 mRNA levels measured in cell lines resistant to various microtubule-stabilizing agents including Taxol were found to be significantly elevated compared to the drug sensitive cell lines. The effect of IGF2 knockdown on Taxol resistance was investigated in vitro and in vivo. Transient IGF2 knockdown significantly sensitized drug resistant cells to Taxol treatment. A Taxol-resistant ovarian cancer xenograft model, developed from HEY-T30 cells, exhibited extreme drug resistance, wherein the maximal tolerated dose of Taxol did not delay tumor growth in mice. Blocking the IGF1R (a transmembrane receptor that transmits signals from IGF1 and IGF2) using a monoclonal antibody did not alter the response to Taxol. However, stable IGF2 knockdown using short-hairpin RNA in HEY-T30 effectively restored Taxol sensitivity. These findings validate IGF2 as a potential therapeutic target in drug resistant ovarian cancer and show that directly targeting IGF2 may be a preferable strategy compared with targeting IGF1R alone.


Conflict of interest statement

Competing Interests: The authors have declared that no competing interests exist.

Figures

Figure 1
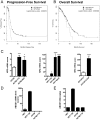
Figure 1. High IGF2 expression is associated with early recurrence, poor survival, and drug resistance.
IGF2 expression and ovarian cancer survival. Using the cBioPortal for Cancer Genomics to analyze the data from the Cancer Genome Atlas study of ovarian serous cystadenocarcinoma, we compared the progression-free survival and overall survival in patients with high tumor levels of IGF2 mRNA (greater than 1.6 standard deviations above the mean; gray line) and those with normal tumor levels of IGF2 mRNA (all other patients; black line). Patients with high IGF2 mRNA levels had significantly shortened progression-free survival (A) and overall survival (B). (C) IGF2 expression in sensitive and resistant cell lines. By RT-qPCR, we measured the IGF2 mRNA level in six drug resistant ovarian carcinoma cell lines and their three cell lines of origin. All drug resistant cell lines have significantly higher IGF2 mRNA expression compared to their sensitive cell line of origin. Bars show the mean±SEM of IGF2 mRNA expression score for at least two independent experiments for each cell line, each done in triplicate, and the symbol above the bar indicates the statistical significance comparing that resistant cell line with its parental counterpart; *p<0.05, ***p<0.001, ****p<0.0001 by One-way ANOVA with Bonferroni posttest. (D) ABCB1 expression. ABCB1 mRNA expression levels were measured by RT-qPCR in HEY, HEY-T30, A2780 and A2780-T15. HEY-T30 has higher ABCB1 mRNA expression compared to the other cell lines. Bars show the mean±SEM of ABCB1 mRNA expression score for at least four independent experiments for each cell line, each done in triplicate, (E) ABCB1 DNA copy number. By qPCR performed on genomic DNA, HEY-T30 has a six-fold increase in ABCB1 DNA copy number indicating gene amplification. Bars show the mean±SEM of two independent experiments, each done in triplicate.
Figure 2
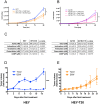
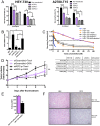
Figure 2. Characterization of the drug resistance phenotype.
Proliferation kinetics of cell lines. Cells were grown in complete media with the indicated concentration of Taxol in 6-well dishes, and cells from duplicate wells counted every 24 hours. (A) HEY-T30 cells in the presence or absence of 30 nM Taxol proliferate more slowly than HEY cells (p<0.05, Repeated Measures Two-way ANOVA, Bonferroni posttest). (B) A2780-T15 in the presence of 2 nM and 15 nM Taxol grow similarly to A2780. However, in the absence of Taxol, A2780-T15 proliferates more slowly, suggesting Taxol dependence (p<0.01, Two-way ANOVA, Bonferroni posttest). Each growth curve represents the mean of at least two independent experiments each done in duplicates, each point is represented as the mean±SEM. (C) IC50’s of chemotherapeutic drugs in sensitive and resistant cell lines. In 96-well plates, cells were treated with serial dilutions of the indicated drugs and the concentration of 50% proliferation inhibition (IC50) determined using the SRB cytotoxicity assay. HEY-T30 are cross-resistant to ixabepilone and to vinblastine. There is modest cross-resistance to doxorubicin but not to CDDP. A2780-T15 are cross-resistant to ixabepilone, and modestly cross-resistant to doxorubicin and CDDP, but more sensitive to vinblastine. Data are presented as the mean±SEM of at least three independent experiments performed with six replicates. P-values calculated by unpaired t-test. (D, E) Comparison of HEY-T30 and HEY xenograft response to Taxol. Following subcutaneous injection of HEY-T30 or HEY cells, mice were divided into treatment groups of 6 animals each. When the average xenograft volume reached 120 mm3, Taxol treatment was administered at the maximal tolerated dose (MTD) of 20 mg/kg intraperitoneally every three days for five treatments (treatment days: 0, 3, 6, 9, 12), resulting in a cumulative dose of 100 mg/kg. Control animals received intraperitoneal injections of the diluent (5% dextrose in water; D5W) according to the same schedule. Tumors were measured every three days, and mean tumor volumes±SEM for each group shown at each time point. HEY xenografts responded to Taxol treatment, which potently suppressed tumor growth (Fig. 2D; dashed blue line). HEY-T30 xenografts did not respond to Taxol treatment (Fig. 2E; dashed orange line) and grew at a similar rate as vehicle-treated HEY-T30 xenografts. HEY Taxol vs HEY D5W on day 19, p<0.001; unpaired t-test.
Figure 3
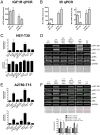
Figure 3. Effects of ligand stimulation and targeted therapeutics on IGF1R and IR expression and phosphorylation.
(A) IGF1R mRNA of sensitive and resistant cell lines. Measured by RT-qPCR (n = 5 independent experiments each done in triplicate), IGF1R mRNA levels are similar when resistant cell lines are compared to their parental cell lines of origin. Bars show the mean±SEM. (B) IR mRNA of sensitive and resistant cell lines. Measured by RT-qPCR (n = 5 independent experiments each done in triplicate) IR-A and IR-B mRNA levels in HEY-T30 are significantly decreased when compared to HEY, while similar levels are observed when comparing A2780-T15 to A2780. Bars show the mean±SEM, ****p<0.0001; unpaired t-test. (C) Phospho-IGF1R and phospho-IR ELISA in HEY-T30. Cells were starved overnight, incubated with 1 µM NVP-AEW541 or 10 µg/ml IMC-A12 for 2 hours, stimulated with 50 ng/ml IGF2 or 50 nM insulin for 10 minutes, lysed, and levels of phosphorylated IGF1R and IR determined by ELISA. Both IGF2 and insulin caused 5- to 6-fold-change increased levels of phospho-IGF1R that could be suppressed by NVP-AEW541 or IMC-A12. The changes in phospho-IR after stimulation with IGF2 or insulin were much smaller (fold-change <1.5). Bars depict mean±SEM fold-change phosphorylation levels of at least two independent experiments, each done in duplicate. (D) Phospho-AKT and phospho-ERK Western blot. Cell lysates prepared as described in (C) were used for immunoblotting using phosphorylation-specific AKT and ERK antibodies. IGF2-induced AKT phosphorylation at threonine 308 and serine 473 was suppressed by NVP-AEW541 and IMC-A12, while total AKT was unchanged. No effect was seen on phospho-ERK levels. One representative experiment of two independent experiments is shown. Equal protein loading was confirmed by Ponceau staining and GAPDH immunoblotting. (E) Phospho-IGF1R and phospho-IR ELISA in A2780-T15. Cells were prepared similarly to (C). IGF2 and insulin caused 7-fold and 10-fold increased levels of phospho-IGF1R, respectively, and this could be suppressed by NVP-AEW541 or IMC-A12. Levels of phospho-IR after IGF2 or insulin stimulation also increased, 4-fold and 9-fold, respectively. Suppression of phospho-IR with NVP-AEW541 was more effective than with IMC-A12, at these concentrations. Bars depict mean fold-change phosphorylation levels±SEM of at least two independent experiments, each done in duplicate. (F) Phospho-AKT and phospho-ERK Western blot. IGF2-induced AKT and ERK phosphorylation was suppressed by NVP-AEW541 but not by IMC-A12. One representative experiment of two independent experiments is shown. Quantitation by densitometry is shown in the accompanying graph, where bars depict the mean expression±SEM (from two independent experiments) of each of the indicated phospho-proteins, normalized to starved unstimulated cells.
Figure 4
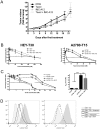
Figure 4. IGF1R-specific inhibition does not alter Taxol resistance.
(A) Combination treatment using Taxol and IMC-A12 in mice with HEY-T30 xenografts. HEY-T30 xenografts were grown as described in Figure 2D, then treated with Taxol (black circles), according to the same dose/schedule described in Figure 2D, or with IMC-A12 (intraperitoneal injection of 40 mg/kg three times per week, grey *), or with combination treatment of Taxol and IMC-A12 (grey x). Data points show the mean tumor volume±SEM for each treatment group (n = 8 animals per group). No significant differences in tumor volume were observed with IMC-A12 or combined Taxol/IMC-A12 treatment compared to D5W or Taxol alone. This experiment was repeated a second independent time with similar results. (B) Effect of IMC-A12 on Taxol sensitivity, evaluated by SRB cytotoxicity assay. In 96-well plates, cells were treated with serial dilutions of Taxol alone (solid lines) or together with a fixed dose of 10 µg/ml IMC-A12 (dashed lines). Dose response curves show the mean of the surviving fraction±SEM of cells relative to untreated cells at the indicated Taxol concentrations (n = 7 independent experiments, each done in six replicates). No significant Taxol sensitization was observed in the presence of IMC-A12. (C) Effect of NVP-AEW541 on Taxol sensitivity, evaluated by SRB cytotoxicity assay. In 96-well plates, cells were treated with serial dilutions of Taxol alone (solid lines) or together with a fixed dose of 1 µM NVP-AEW541 (dashed lines). Dose response curves show the mean±SEM of the surviving fraction of cells relative to untreated cells at the indicated Taxol concentrations. The bar graphs depict the IC50 of Taxol for the indicated cell lines and drug treatments, and show the mean±SEM calculated from at least four independent experiments (each done in six replicates). NVP-AEW541 sensitizes A2780-T15 to Taxol. ***p<0.001, ****p<0.0001; One-way ANOVA with Bonferroni posttest. (D) ABCB1 (p-glycoprotein) function in HEY and HEY-T30 in the presence and absence of NVP-AEW541. Cells were incubated with labeled Taxol (Oregon Green 488 Taxol, bis-acetate) in the presence or absence of NVP-AEW541 or verapamil. The ABCB1-overexpressing HEY-T30 cells (light gray shaded graph) retain less labeled Taxol than HEY cells (unfilled black outline). Verapamil, a known p-glycoprotein inhibitor, markedly increases the retention of labeled Taxol in HEY-T30 cells (and to a lesser degree in HEY cells), as demonstrated by the rightward shift of the peaks. Shown in the right panel with the dashed black line, treatment with 1 µM NVP-AEW541 does not appear to affect retention of labeled Taxol in HEY-T30 cells. Two independent experiments were done with similar results.
Figure 5
Figure 5. IGF2 knockdown restores Taxol sensitivity.
(A) Taxol sensitivity after IGF2 knockdown by siRNA. HEY-T30 and A2780-T15 cells were transfected with control nontargeting siRNA (siCTRL) or siRNAs targeting IGF2 (siIGF2-1, siIGF2-2, siIGF2-3), and treated with DMSO or Taxol at the approximate IC50 (100 nM for HEY-T30 and 15 nM for A2780-T15). The surviving fraction was reduced after IGF2 siRNA transfection compared to control siRNA transfection. The effect of Taxol was significantly enhanced in both HEY-T30 and A2780-T15 by IGF2 siRNA transfection compared with control siRNA transfection. Bars represent the mean of four independent experiments (each done in duplicate)±SEM; *p<0.05, **p<0.01, ***p<0.001, ****p<0.0001; Two-way ANOVA with Bonferroni posttest. (B) IGF2 mRNA after stable knockdown with shRNA. HEY-T30 cells were transfected with shRNA targeting IGF2 by plasmid transfection (shIGF2-p) or lentiviral infection (shIGF2-v), or with a control vector containing the scrambled version of the IGF2 targeting sequence (shScrambled). Clonal stably-transfected cell lines were used for all experiments. IGF2 mRNA levels are depicted in bars±SEM. The shIGF2-p and shIGF2-v cell lines have low IGF2 mRNA levels similar to HEY, whereas HEY-T30 and shScrambled cell lines had several-fold higher mRNA expression levels. (n>6 independent experiments, each done in triplicate) *p<0.05; One-way ANOVA with Bonferroni posttest. (C) Cytotoxicity assays in cell lines with IGF2 shRNA. The indicated cell lines were treated with serial dilutions of Taxol, and sensitivity to Taxol determined by the sulforhodamine B assay. The dose-response curves are shown on the left, with the mean±SEM go the surviving fraction of cells relative to untreated cells shown at the indicated Taxol concentrations. The mean IC50 values±SEM for the indicated cell lines and drugs are shown in the table below. HEY T30 shIGF2-p and HEY-T30 shIGF2-v were significantly more sensitive to Taxol, ixabepilone, and vinblastine compared to control transfected HEY-T30 (shScrambled) or untransfected HEY-T30. The efficacy of IGF2 knockdown at restoring sensitivity to Taxol was similar to NVP-AEW541 treatment. Only 1.6 fold sensitization to doxorubicin and no effect on cisplatin sensitivity were observed in shIGF2 lines compared to shScrambled or untransfected HEY-T30. Asterisks denote the statistical significance when comparing the IC50 for the indicated shIGF2 cell line versus shScrambled, where *p<0.05, **p<0.01, ****p<0.0001; Two-way ANOVA with Bonferroni posttest. (n = 5 independent experiments each done in six replicates). (D) Xenograft growth with Taxol treatment of HEY-T30 shIGF2-p and HEY-T30 shScrambled. Female athymic nude mice were subcutaneously injected with 1 million HEY-T30 shScrambled or HEY-T30 shIGF2-p cells and tumors were allowed to grow to an average volume of 120 mm3. Mice were then treated with either D5W (vehicle) or Taxol at the MTD (described in 2D). Tumors were measured every three days, and data points show the mean tumor volume±SEM for each group at each time point. Two independent experiments were done for a total of 8–10 animals per group. shIGF2-p xenografts responded to Taxol treatment (triangle, dashed black line) and showed significantly tumor growth suppression compared to treatment with D5W (circle, solid black line); at day 12, **p<0.01 for shIGF2-p Taxol vs shIGF2-p D5W; One-way ANOVA with Bonferroni posttest. In contrast, HEY-T30 shScrambled xenografts did not respond to Taxol (+, dashed purple line) and continued growing at a similar rate as the vehicle-treated HEY-T30 shScrambled group (x, solid purple line). No significant difference in tumor size was observed between D5W-treated shIGF2-p and shScrambled xenografts at day 12. Representative tumor xenografts were excised on day 13 after treatment for further analysis. (E, F) IGF2 immunohistochemical staining of xenografts. Excised tumor xenografts (n = 2 animals per group) on day 13 after treatment initiation were formalin-fixed, paraffin embedded and sections stained with hematoxylin and eosin or with an anti-human IGF2 antibody. Staining was evaluated by the pathologist blinded to the groups and the mean of H-scores±SEM calculated and graphed (E). (F) Shows representative HEY-T30 shScrambled and HEY-T30 shIGF2 xenograft sections stained with hematoxylin and eosin (H&E) or with anti-IGF2 antibody (right panels). HEY-T30 shIGF2-p xenografts showed lower IGF2 expression when compared to HEY-T30 shScrambled.
Figure 6
Figure 6. IGF2 knockdown alters the cellular response to Taxol.
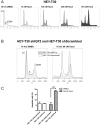
Taxol-induced G2/M arrest. (A) HEY-T30 cells were treated for 16 hours with the indicated concentrations of Taxol, and DNA content analyzed by flow cytometry. In HEY-T30 cells, G2/M arrest occurred after Taxol treatment at 375 nM but not lower concentrations. (B) shows HEY-T30 shIGF2-p (gray shaded) and HEY-T30 shScrambled (black dotted line) treated with DMSO or with Taxol (50 nM) for 16 hours. The HEY-T30 shIGF2-p cells showed G2/M arrest in response to Taxol while HEY-T30 shScrambled cells did not, at this Taxol concentration. Data from one representative experiment, of two independent experiments, are shown. (C) Apoptosis analysis. Similar to (B), cells were treated with Taxol (50 nM) for 16 hours, harvested and stained with F2N12S (membrane asymmetry marker) and Sytox (dead cell marker), and analyzed by flow cytometry. Cell populations were gated in quadrants for quantitation, where the early apoptotic cell population is delineated by their decreased 585 nm/530 nm ratio due to loss of membrane asymmetry compared to non-apoptotic cells, and are Sytox-negative. Taxol treatment of HEY-T30 shIGF2-p cells resulted in a higher percentage of apoptotic cells compared to treatment with vehicle (DMSO), and Taxol-induced apoptosis was significantly enhanced in HEY-T30 shIGF2 cells compared to HEY-T30 shScrambled, at this time point. **p<0.01; One-way ANOVA with Bonferroni posttest. The bars show the mean±SEM of two independent experiments.

Similar articles

Cited by

References

    1. Vaughan S, Coward JI, Bast RC, Berchuck A, Berek JS, et al. (2011) Rethinking ovarian cancer: recommendations for improving outcomes. Nat Rev Cancer 11: 719–725 10.1038/nrc3144 - DOI - PMC - PubMed
    1. Ratajczak MZ, Shin D-M, Schneider G, Ratajczak J, Kucia M (2013) Parental imprinting regulates insulin-like growth factor signaling: a Rosetta Stone for understanding the biology of pluripotent stem cells, aging and cancerogenesis. Leukemia 27: 773–779 10.1038/leu.2012.322 - DOI - PMC - PubMed
    1. Baker J, Liu JP, Robertson EJ, Efstratiadis A (1993) Role of insulin-like growth factors in embryonic and postnatal growth. Cell 75: 73–82. - PubMed
    1. Gallagher EJ, LeRoith D (2011) Minireview: IGF, Insulin, and Cancer. Endocrinology 152: 2546–2551 10.1210/en.2011-0231 - DOI - PubMed
    1. Pollak M (2012) The insulin and insulin-like growth factor receptor family in neoplasia: an update. Nat Rev Cancer 12: 159–169 10.1038/nrc3215 - DOI - PubMed

Publication types

MeSH terms