. 2014 Jun 23;205(6):829-46.
doi: 10.1083/jcb.201403021. Epub 2014 Jun 16.

The Cavβ1a subunit regulates gene expression and suppresses myogenin in muscle progenitor cells

Affiliations

The Cavβ1a subunit regulates gene expression and suppresses myogenin in muscle progenitor cells

Jackson Taylor et al. J Cell Biol. .

Abstract

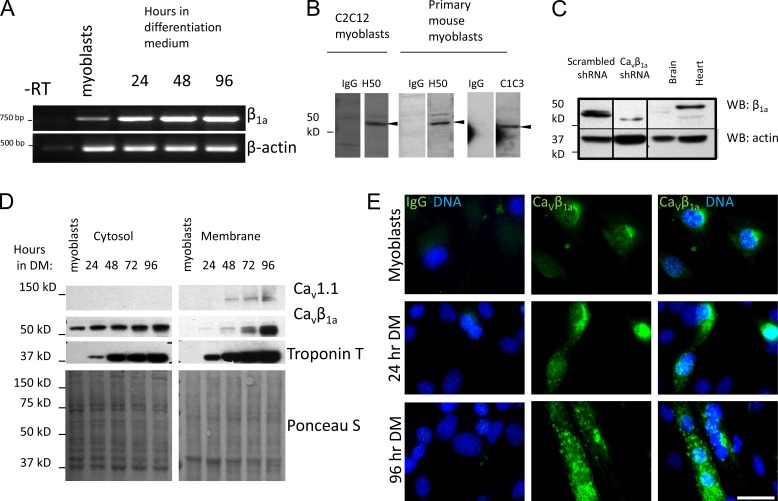
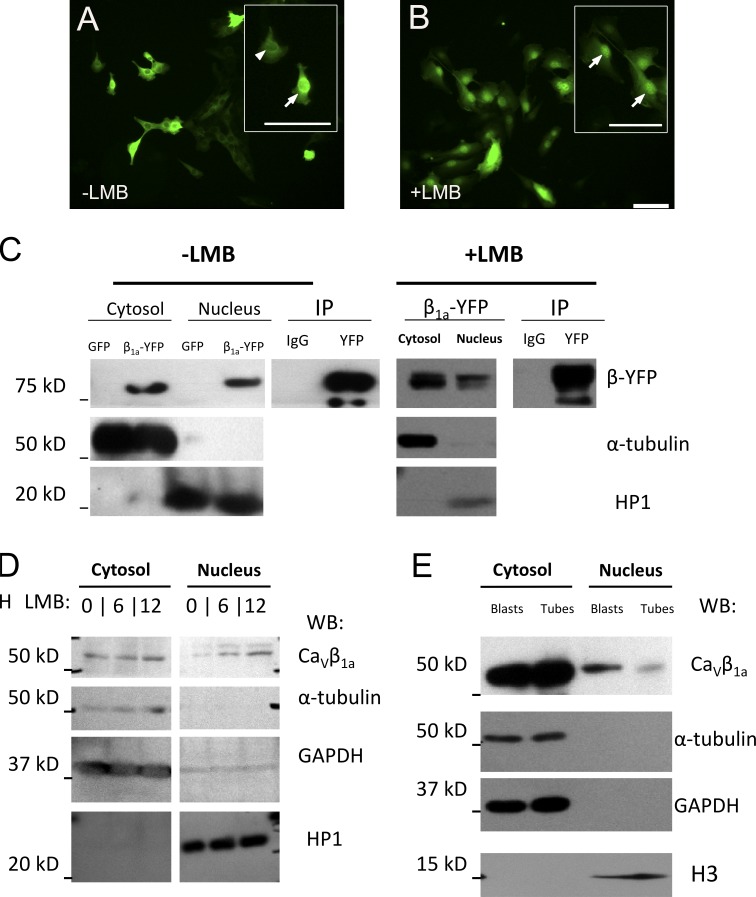
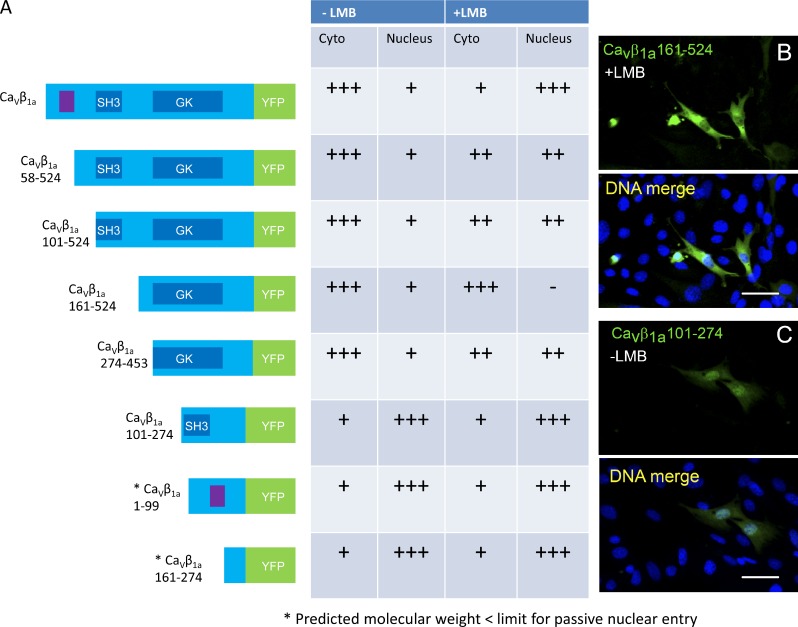
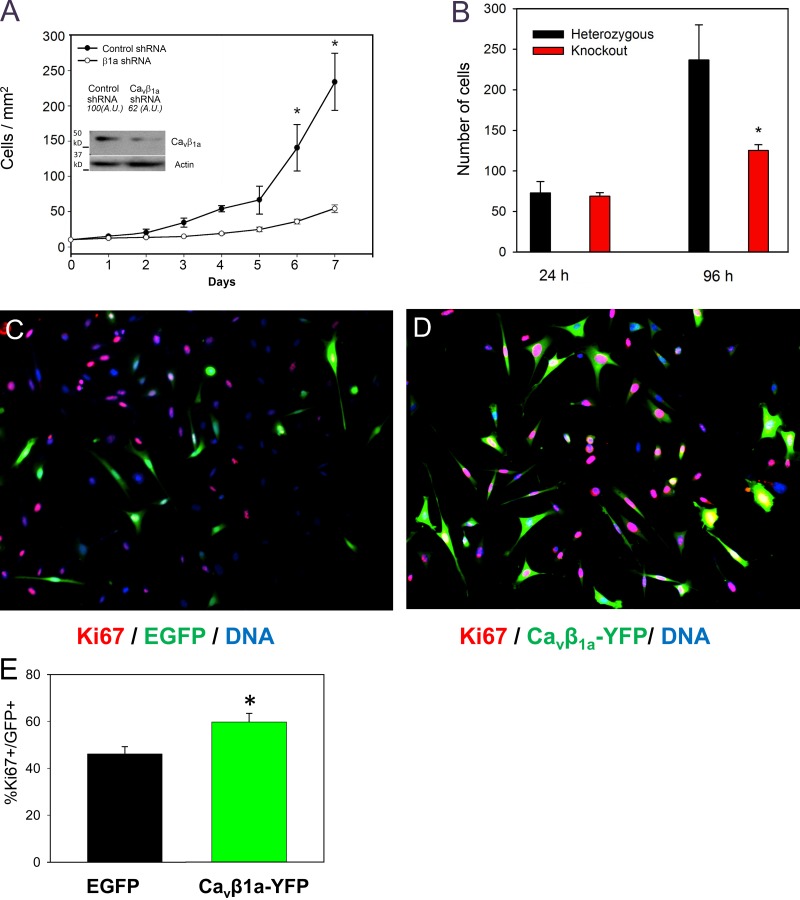
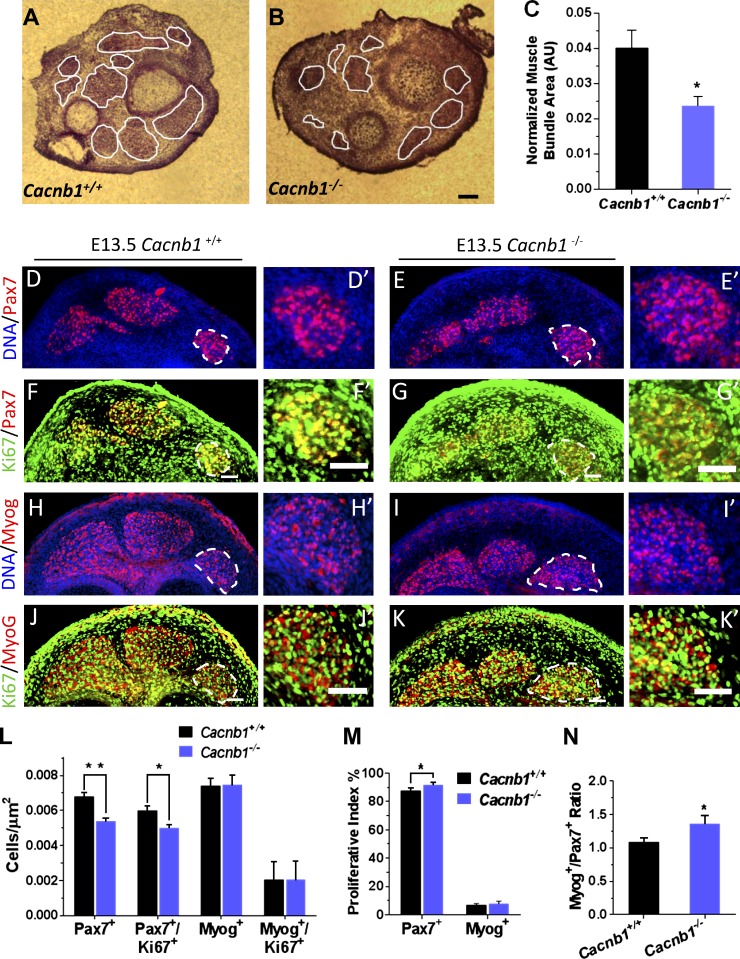
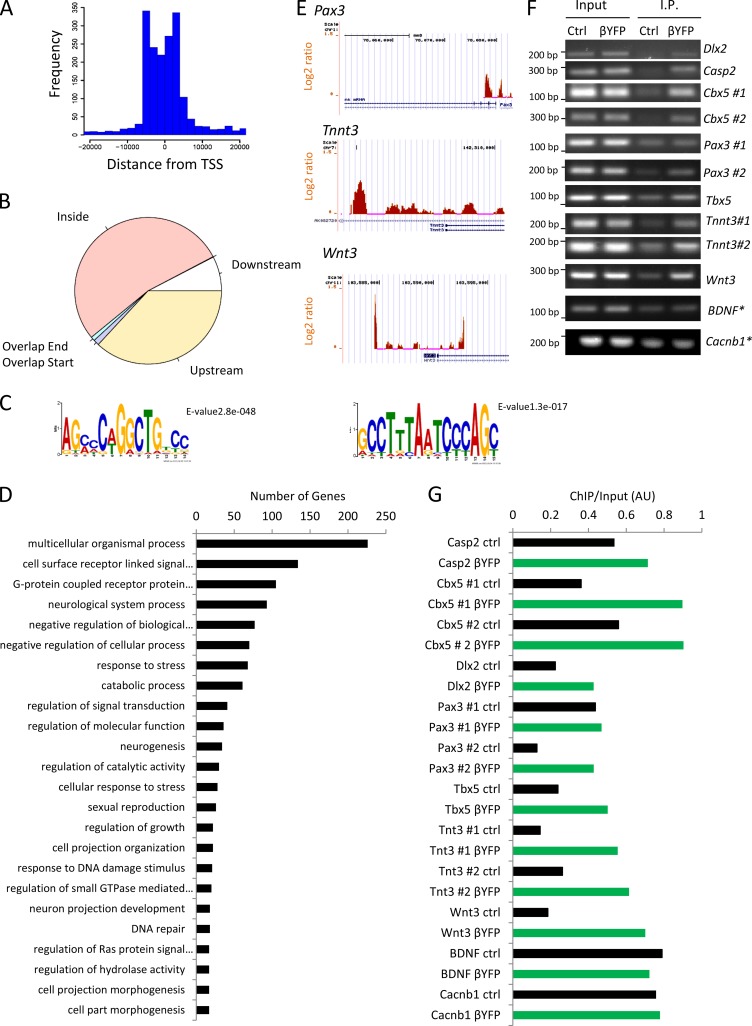
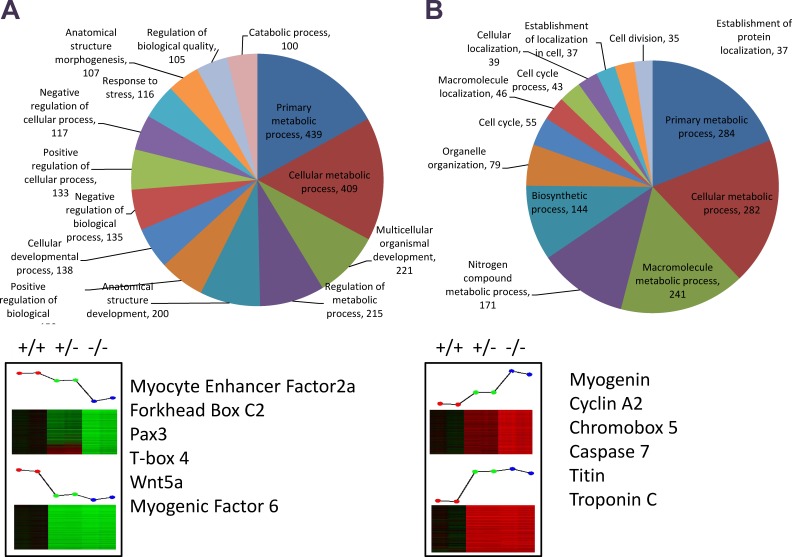
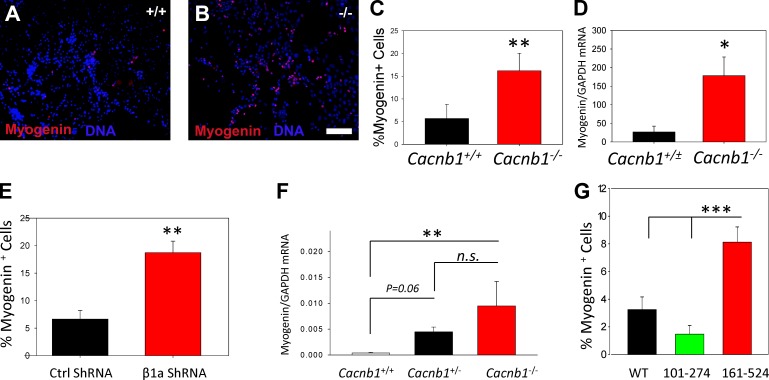
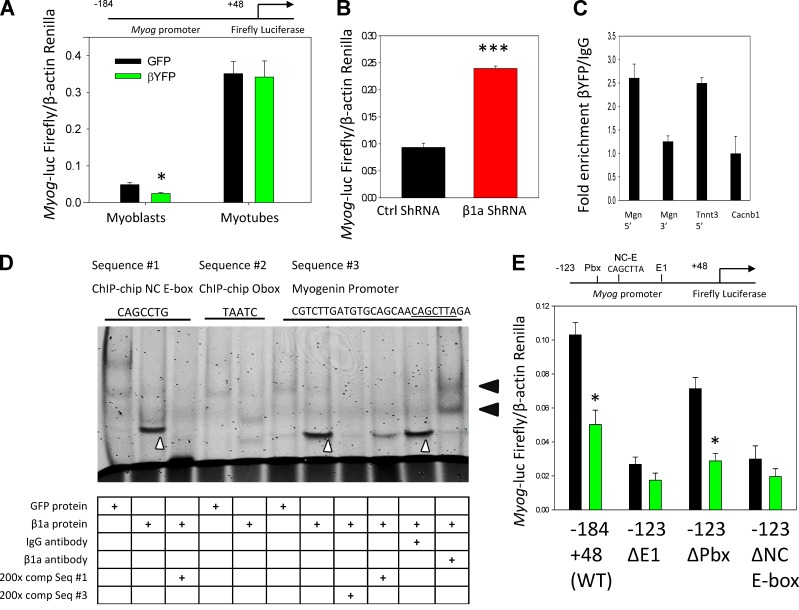
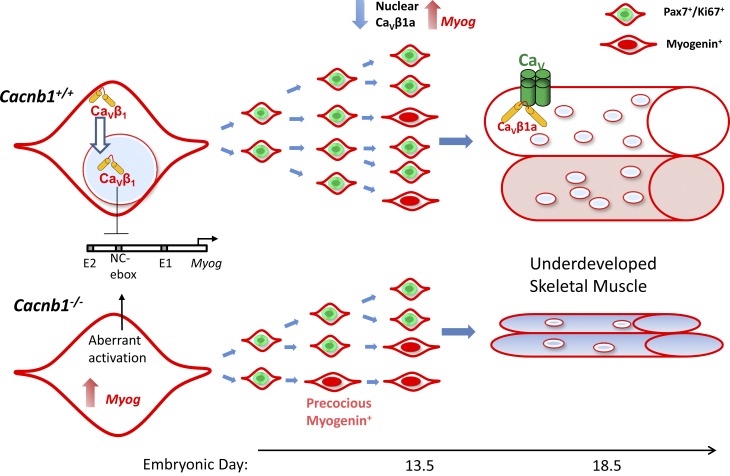
Voltage-gated calcium channel (Cav) β subunits are auxiliary subunits to Cavs. Recent reports show Cavβ subunits may enter the nucleus and suggest a role in transcriptional regulation, but the physiological relevance of this localization remains unclear. We sought to define the nuclear function of Cavβ in muscle progenitor cells (MPCs). We found that Cavβ1a is expressed in proliferating MPCs, before expression of the calcium conducting subunit Cav1.1, and enters the nucleus. Loss of Cavβ1a expression impaired MPC expansion in vitro and in vivo and caused widespread changes in global gene expression, including up-regulation of myogenin. Additionally, we found that Cavβ1a localizes to the promoter region of a number of genes, preferentially at noncanonical (NC) E-box sites. Cavβ1a binds to a region of the Myog promoter containing an NC E-box, suggesting a mechanism for inhibition of myogenin gene expression. This work indicates that Cavβ1a acts as a Cav-independent regulator of gene expression in MPCs, and is required for their normal expansion during myogenic development.


Figures

Figure 1.
Figure 1.
Cavβ1a expression in MPCs. (A) mRNA expression of Cavβ1a in primary MPCs cultured in GM (myoblasts) and after 24, 48, or 96 h in DM (−RT, nonreverse-transcribed control). (B) Expression of Cavβ1a protein in C2C12 myoblasts and primary MPCs detected by Western blot using antibody clones H-50 and C1C3. A distinct band was detected (arrowheads) with a molecular weight of ∼55 kD. Each lane represents individual strip cut from same membrane. (C) Western blot for Cavβ1a expression in C2C12 stably transfected with scrambled control or Cavβ1a-specific shRNA. Brain and heart protein lysates were also run as negative controls. (D and E) C2C12 myoblasts were grown to confluence in GM, then switched to DM for analysis at 24-h intervals. (D) Western blot for Cavβ1a and Cav1.1 in cytosolic and membrane fractions. Troponin T is a marker of myogenic differentiation and Ponceau S stain shows equal loading. (E) Immunofluorescent staining for endogenous Cavβ1a (green) and DNA (Hoechst stain, blue). Some nuclei are out of focus with visible Cavβ1a staining. Bar, 100 µm.
Figure 2.
Figure 2.
Cavβ1a-YFP and endogenous Cavβ1a translocate to the nucleus of myoblasts. (A) C2C12 myoblasts transfected with Cavβ1a-YFP, and (B) after treatment with LMB. Arrowhead indicates cell with predominantly cytoplasmic Cavβ1a-YFP, arrows indicate cells with predominantly nuclear Cavβ1a-YFP. Bars, 100 µm. (C) Detection and immunoprecipitation of Cavβ1a-YFP in the nuclear fraction of untreated and LMB-treated C2C12 myoblasts by Western blot. (D) Western blot for endogenous Cavβ1a in C2C12 myoblasts. Cytosolic and nuclear fractions of C2C12 myoblasts treated with LMB for 0, 6, and 12 h. (E) Comparison of Cavβ1a protein levels in cytoplasmic and nuclear fractions in myoblasts vs. myotubes. Tubulin and GAPDH are cytosolic markers, and HP1 and H3 are nuclear proteins. Figures are representative of at least two independent experiments.
Figure 3.
Figure 3.
Mapping of the CaVβ1a nuclear localization domain. (A) Diagram of constructed CaVβ1a-YFP truncation mutants and respective cytoplasmic and nuclear intensity in untreated and LMB-treated cells. Conserved SH3 and GK domains are noted in dark blue, putative NLS highlighted in purple, and YFP sequence in green. Construct names indicate amino acids remaining after truncation, with CaVβ1a-1-524 as full-length CaVβ1a. Table reflects relative intensity of cytoplasmic (Cyto) and nuclear Cavβ1a. (B) Enlarged image of CaVβ1a-161-524, which is absent from the nucleus after LMB treatment. (C) Enlarged image of CaVβ1a-101-274, which is present in the nucleus without LMB treatment. Nuclei (DNA) in all images were stained blue with Hoechst dye. Bars: (B and C) 50 µm.
Figure 4.
Figure 4.
Regulation of myoblast proliferation by Cavβ1a in vitro and in vivo. (A) Quantification of myoblast growth for 7 d after transfection with either scrambled control shRNA or Cavβ1a-targeted shRNA (Western blot of Cavβ1a knockdown is inset). (B) Quantification of MPCs cultured from Cacnb1+/− and Cacnb1−/− embryos for 4 d (n = 4). (C–E) Primary mouse myoblasts transfected with EGFP (C) or Cavβ1a-YFP (D) and stained 24 h later for Ki67 (red; n = 3). Bar, 100 µm. (E) Quantification of Ki67+/EGFP and Ki67+/Cavβ1a-YFP cells expressed as a percentage of total EGFP or Cavβ1a-YFP + cells. *, P < 0.05.
Figure 5.
Figure 5.
Impaired skeletal muscle development in Cacnb1−/− mice. (A–C) H&E staining of early muscle bundles in E13.5 Cacnb1+/+ (A) and Cacnb1−/− (B) embryos (n = 3). Eosin positive bundles were traced, averaged, and normalized to overall cross section size (C). Bar, 100 µm. (D–N) Analysis of myogenic markers in Cacnb1+/+ and Cacnb1−/− E13.5 embryos. Cross sections from Cacnb1+/+ (D, F, H, and J) and Cacnb1−/− (E, G, I, and K) were stained for Pax7 (red) and Ki67 (green; D–G) or myogenin (red) and Ki67 (green; H–K). Nuclei (DNA) in all slides were stained blue with Hoechst dye. D′–K′ show magnified views of adjacent muscle bundles (dashed lines). Bars, 50 µm. (L) Quantification of absolute number of Pax7+ and myogenin+ cells, and absolute number of double-positive Pax7+/Ki67+ or myogenin+/Ki67+ cells, per µm2. (M) Proliferative index as measured by percentage of Pax7+ or myogenin+ cells that were also Ki67+. (N) Ratio of absolute number of myogenin+ to Pax7+ cells, per µm2. n = 3 embryos each, 3 histological sections quantified per embryo. Data are mean ± SEM; *, P < 0.05; **, P < 0.005.
Figure 6.
Figure 6.
ChIP-on-chip analysis of Cavβ1a. (A) Histogram of Cavβ1a-binding distance from transcription start site. (B) Distribution of features of each Cavβ1a peak relative to overlapping or nearest genes. (C) Top two consensus Cavβ1a DNA-binding motifs. (D) Functional annotation of genes bound by Cavβ1a. Top 20 categories are shown. (E) Representative log2 (Cavβ1a/IgG) binding peaks on genes of interest in UCSC genome browser. Orange peaks indicate positive log2 Cavβ1a/IgG values and presumed sites of Cavβ1a chromatin binding; blue indicates negative enrichment. (F and G) Validation of ChIP-chip–identified target genes by chromatin immunoprecipitation using a GFP antibody in control and Cavβ1a-YFP–transfected C2C12 myoblasts. “#” indicates separate primer pairs used to test multiple sites on each promoter region. Asterisk indicates negative controls. Immunoprecipitated DNA intensity was normalized to input for control and Cavβ1a-YFP (G).
Figure 7.
Figure 7.
Microarray analysis of Cacnb1 wild-type (+/+), heterozygous (+/−), and knockout (−/−) MPCs. Genes were selected based on dose-dependent correlation with Cacnb1 expression. Genes said to be up-regulated by Cacnb1 are lowest in −/− cells and functionally annotated in A, whereas genes said to be down-regulated by Cacnb1 are highest in −/− cells and functionally annotated in B. GOTERM “other” (1,640 for A and 234 for B) was omitted from charts in order to improve visibility of other categories. Genes of interest involved in cell cycle and muscle development are listed below pie charts. See also Fig. S3 and Table S4.
Figure 8.
Figure 8.
Cacnb1 modulates Myog expression in muscle progenitors. Representative images from Cacnb1+/+ (A) and Cacnb1−/− (B) E18.5 hindlimb explants cultures after 3 d in vitro. Bar, 100 µm. Cultures were then fixed and stained for myogenin (C; n = 5 and 3) or analyzed by quantitative PCR (D; n = 3 each, note that Cacnb1+/+ and Cacnb1+/− are pooled). (E) Quantification of myogenin-positive cells in control and Cavβ1a-shRNA–treated primary MPC cultures (n = 3 each). (F) qPCR for myogenin mRNA from hindlimb buds dissected from Cacnb1+/+, Cacnb1+/−, and Cacnb1−/− E11.5 embryos (n = 6–12 each). (G) Quantification of myogenin expression in differentiating (1 d DM) C2C12 myoblasts, transfected with full-length, nuclear (101–274), or cytoplasmic (161–524) Cavβ1a-YFP constructs (n = 6 each). Data are ± SEM; *, P ≤ 0.05; **, P ≤ 0.01; ***, P ≤ 0.001.
Figure 9.
Figure 9.
Cavβ1a action at the Myog promoter. (A) Myog-luc expression in GFP (black) or Cavβ1a-YFP (green) expressing myoblasts (n = 5) and myotubes (n = 6). (B) Myog-luc expression in control (black) and Cavβ1a-shRNA (red)–transfected C2C12 myoblasts (n = 3). (C) ChIP-qPCR showing relative fold enrichment of Cavβ1a-YFP pull-down of Myog promoter (Mgn 5′) and Tnnt3 promoter (Tnnt3), with Myog 3′ region (Mgn 3′) and Cacnb1 exon 5 (Cacnb1) as controls. (D) Gel shift assay using GFP protein (control) or Cavβ1a-YFP protein from Cos7 nuclear extracts. Mouse IgG is nonspecific antibody. A specific shift can be seen in lanes 2, 7, and 10 (white carats), and supershift induced by YFP antibody seen in lane 11 (black arrowheads). Fluorescently labeled probe sequences (top) were generated from ChIP-chip motif results (sequences #1 and #2) and from the Myog promoter (sequence #3; NC E-box motif underlined). Full probe sequences are available in Table S1. (E) Mutation analysis of Myog promoter. C2C12 were transfected with GFP (black) or Cavβ1a-YFP (green) and then wild-type (−184 +48) Myog-luc, or −123 +48 fragments with mutations in E1 E-box (ΔE1), Pbx1 (ΔPbx), or noncanonical E-box (ΔNC E-box; CAGCTTA sequence indicated in D has been mutated to TGGCTTA) Myog-luc constructs, n = 3 per group. Locations of mutations are indicated above. See Berkes et al. (2004) for origin of these constructs. Data are ± SEM; *, P ≤ 0.05; ***, P ≤ 0.001.
Figure 10.
Figure 10.
Mechanism of CaVβ1a regulation of myogenesis. In Cacnb1+/+ MPCs, CaVβ1a enters the nucleus and acts on an NC E-box on the Myog promoter, suppressing Myog expression and allowing Pax7+ MPCs to proliferate in sufficient quantity. Following differentiation cues, CaVβ1a exits the nucleus and Myog is disinhibited, allowing terminal differentiation and fusion of myotubes. In Cacnb1−/− MPCs, Myog is not properly suppressed, leading to increased probability of Myog up-regulation and precocious differentiation. The number of myogenin-expressing cells is initially higher, but because their formation also depletes the Pax7+ progenitor pool, there are fewer precursors to form myogenin-positive cells at later time points. The final result is underdeveloped skeletal muscle.

References

    1. Bailey T.L., Boden M., Buske F.A., Frith M., Grant C.E., Clementi L., Ren J., Li W.W., Noble W.S. 2009. MEME SUITE: tools for motif discovery and searching. Nucleic Acids Res. 37(Web Server, Web Server issue):W202–W208 10.1093/nar/gkp335 - DOI - PMC - PubMed
    1. Béguin P., Nagashima K., Gonoi T., Shibasaki T., Takahashi K., Kashima Y., Ozaki N., Geering K., Iwanaga T., Seino S. 2001. Regulation of Ca2+ channel expression at the cell surface by the small G-protein kir/Gem. Nature. 411:701–706 10.1038/35079621 - DOI - PubMed
    1. Béguin P., Mahalakshmi R.N., Nagashima K., Cher D.H., Ikeda H., Yamada Y., Seino Y., Hunziker W. 2006. Nuclear sequestration of beta-subunits by Rad and Rem is controlled by 14-3-3 and calmodulin and reveals a novel mechanism for Ca2+ channel regulation. J. Mol. Biol. 355:34–46 10.1016/j.jmb.2005.10.013 - DOI - PubMed
    1. Berkes C.A., Bergstrom D.A., Penn B.H., Seaver K.J., Knoepfler P.S., Tapscott S.J. 2004. Pbx marks genes for activation by MyoD indicating a role for a homeodomain protein in establishing myogenic potential. Mol. Cell. 14:465–477 10.1016/S1097-2765(04)00260-6 - DOI - PubMed
    1. Bichet D., Cornet V., Geib S., Carlier E., Volsen S., Hoshi T., Mori Y., De Waard M. 2000. The I-II loop of the Ca2+ channel alpha1 subunit contains an endoplasmic reticulum retention signal antagonized by the beta subunit. Neuron. 25:177–190 10.1016/S0896-6273(00)80881-8 - DOI - PubMed

Publication types