Review
. 2014 Jul;98 Suppl 2(Suppl 2):ii1-9.
doi: 10.1136/bjophthalmol-2014-305156.

On improving the use of OCT imaging for detecting glaucomatous damage

Affiliations
Review

On improving the use of OCT imaging for detecting glaucomatous damage

Donald C Hood et al. Br J Ophthalmol. 2014 Jul.

Abstract

Aims: To describe two approaches for improving the detection of glaucomatous damage seen with optical coherence tomography (OCT).

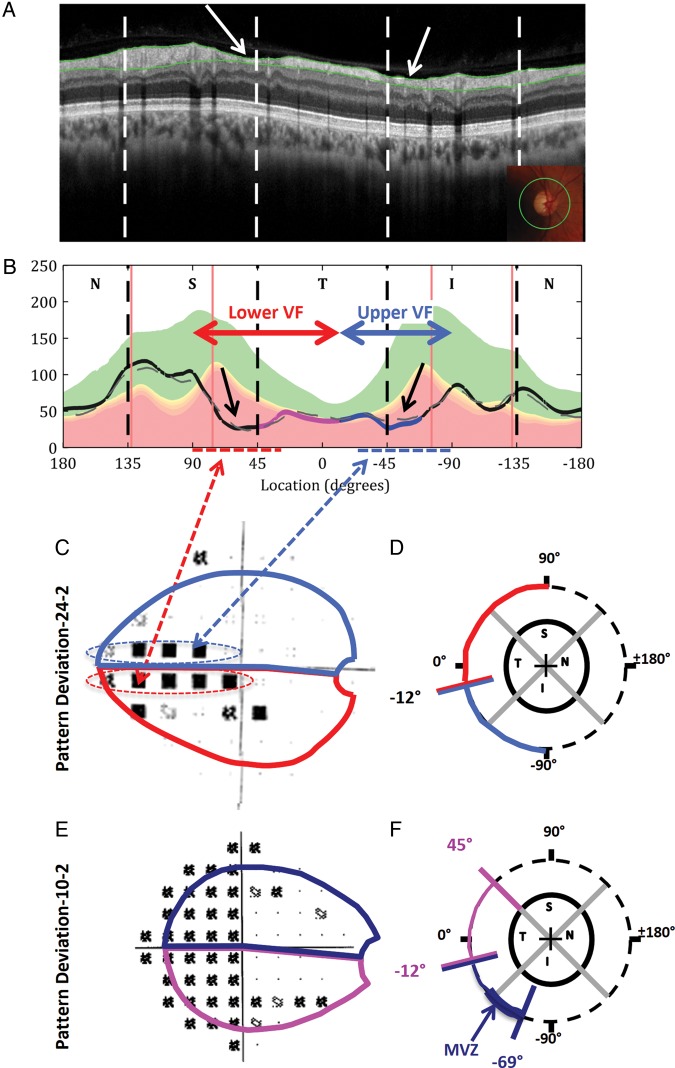
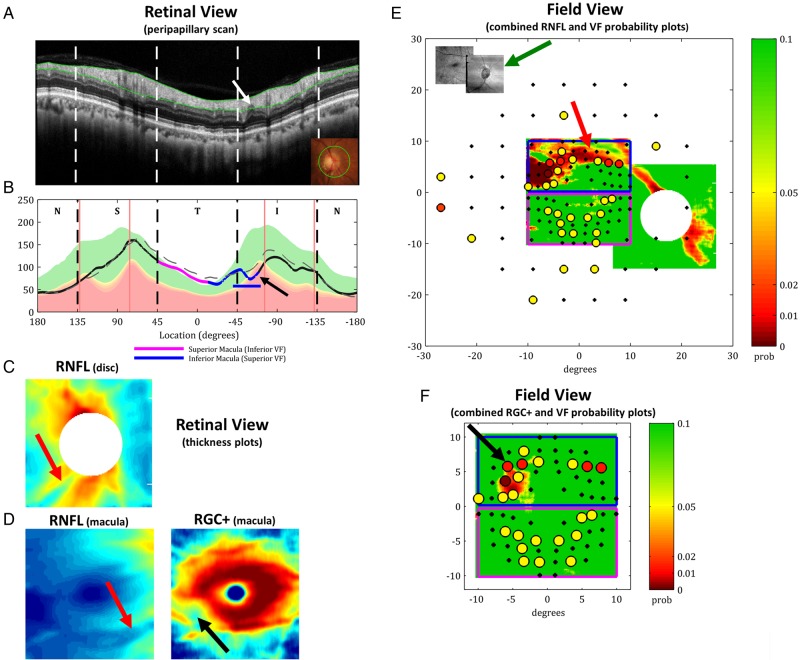
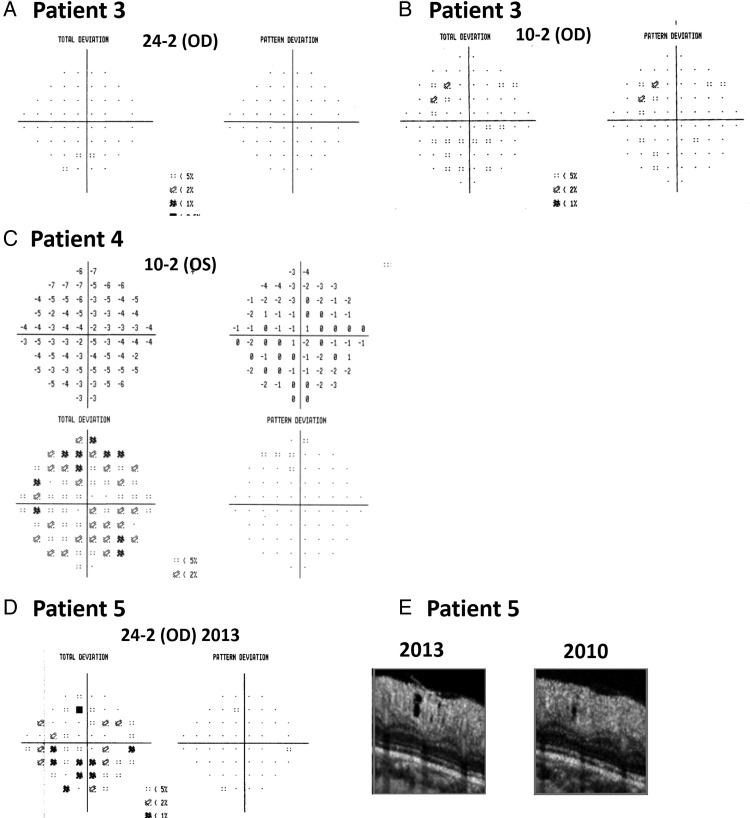
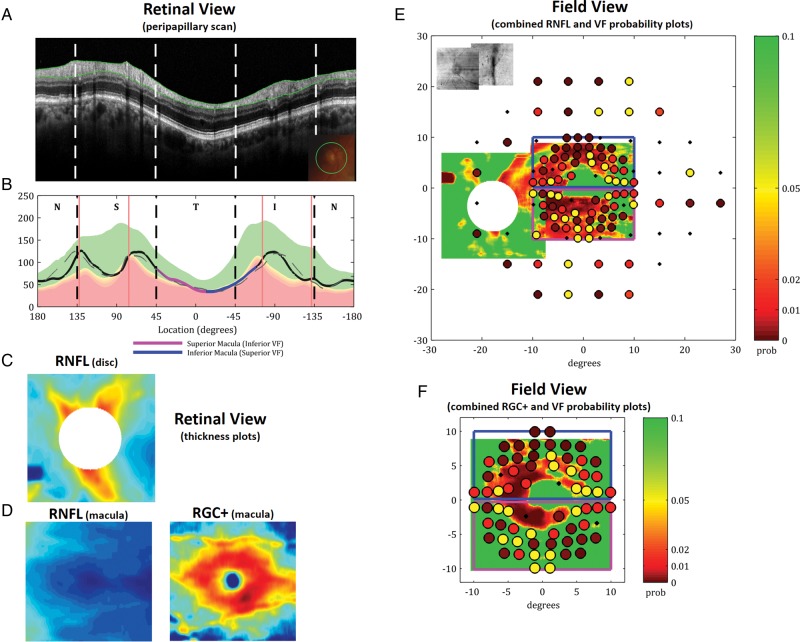
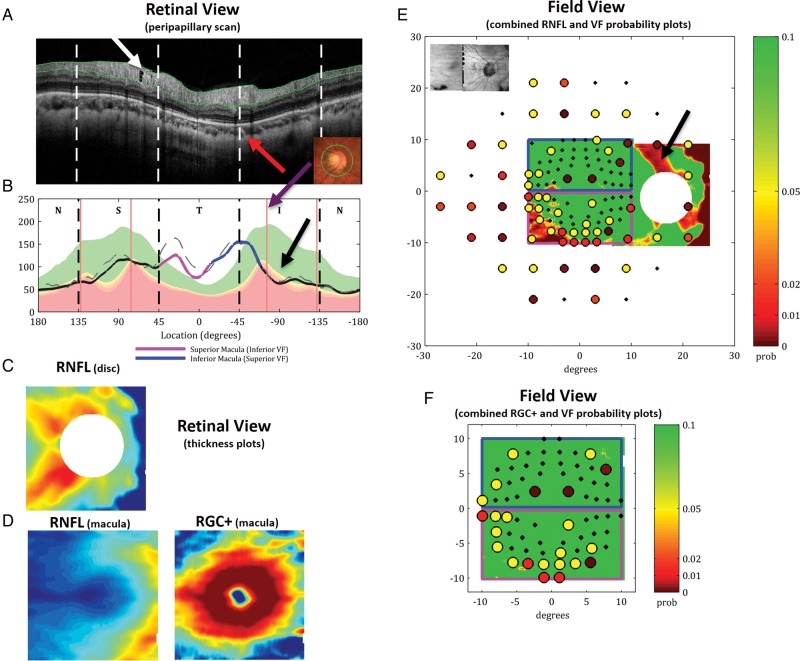
Methods: The two approaches described were: one, a visual analysis of the high-quality OCT circle scans and two, a comparison of local visual field sensitivity loss to local OCT retinal ganglion cell plus inner plexiform (RGC+) and retinal nerve fibre layer (RNFL) thinning. OCT images were obtained from glaucoma patients and suspects using a spectral domain OCT machine and commercially available scanning protocols. A high-quality peripapillary circle scan (average of 50), a three-dimensional (3D) scan of the optic disc, and a 3D scan of the macula were obtained. RGC+ and RNFL thickness and probability plots were generated from the 3D scans.

Results: A close visual analysis of a high-quality circle scan can help avoid both false positive and false negative errors. Similarly, to avoid these errors, the location of abnormal visual field points should be compared to regions of abnormal RGC+ and RNFL thickness.

Conclusions: To improve the sensitivity and specificity of OCT imaging, high-quality images should be visually scrutinised and topographical information from visual fields and OCT scans combined.

Keywords: Glaucoma; Imaging; Optic Nerve; Psychophysics.


Figures

Figure 1
Figure 1
Peripapillary retinal nerve fibre layer data from Patient 1, showing (A) the report from the Zeiss Stratus time-domain optical coherence tomography (tdOCT) machine based on the average of 3 scans for both eyes (RNFL Thickness (3.4) protocol), (B) the TSNIT circle scan path on top of infrared fundus (left) and a single raw circle tdOCT image (right) for the right eye, (C) the sdOCT TSNIT circle scan path on top of fundus (left) and averaged circle sdOCT image (right) for the same eye, and (D) the sdOCT NSTIN circle scan path (left) and averaged circle sdOCT image (right).
Figure 2
Figure 2
Visual field (VF) and spectral domain optical coherence tomography (sdOCT) data for Patient 2 along with models relating VF locations to OCT, all shown as if for right eye. (A) The NSTIN averaged circle sdOCT image with computer-derived retinal nerve fibre layer (RNFL) segmentation (green lines) and corresponding circle scan path on top of fundus (inset). (B) The averaged circle RNFL thickness (grey dashed line) calculated based on the segmentation in (A) and the extracted circle RNFL thickness (solid black line), with regions corresponding to the superior (magenta) and inferior (dark blue) macula in unique colours. Both RNFL thickness plots are superimposed on coloured regions indicating the 95% to 5% (green), 5% to 1% (yellow), and less than 1% (red) ranges of normative data. The red vertical lines indicate the average location of the major blood vessels in a group of patients. (C) The 24-2 VF for the same patient with (D) a model relating the locations of the VF to regions of the circle scans. (E) The 10-2 VF for the same patient with (F) a model relating the locations of the VF to regions of the circle scans. The bold dark blue line indicates the macular vulnerability zone (MVZ).
Figure 3
Figure 3
The single-page spectral domain optical coherence tomography report for Patient 3 showing (A) an enlarged averaged circle scan in NSTIN view as in figure 2A, (B) the corresponding retinal nerve fibre layer (RNFL) thickness as in figure 2B, (C) the 2D RNFL thickness from the 3D disc scan, (D) the 2D RNFL (left) and retinal ganglion cell (RGC)+ (right) thicknesses from the 3D macular scan, (E) the co-registered macular and disc 2D RNFL thickness probability plots in field view with the 24-2 and 10-2 visual field (VF) test point probabilities superimposed (see colour bar) with an inset of the co-registered shadowgrams of the 3D scans (green arrow), and (F) the macular 2D RGC+ thickness probability plot in field view with the 10-2 VF test point probabilities superimposed (see colour bar) as in (E).
Figure 4
Figure 4
(A) The 24-2 and (B) 10-2 visual field (VF) data for Patient 3. (C) The 10-2 VF data for Patient 4, (D) the 24-2 VF data from 2013 for Patient 5, and (E) enlargements of a hole observed in the averaged circle scan of Patient 5 in both 2013 (left) and 2010 (right).
Figure 5
Figure 5
The single-page spectral domain optical coherence tomography report for Patient 4 as in figure 3 showing diffuse retinal ganglion cell (RGC)+ thinning (panel D, right). The agreement of the RGC+ (panel F) and retinal nerve fibre layer (RNFL) (panel E) probability plots with the visual field (VF) probability plot suggests diffuse macular damage.
Figure 6
Figure 6
The single-page spectral domain optical coherence tomography report for Patient 5 as in figure 3 illustrating the need for a close scrutiny of peripapillary scans (panel A). The peripapillary retinal nerve fibre layer (RNFL) thickness plot (panel B) and the RNFL probability plot (panel E) suggest an abnormally thin RNFL associated with the upper visual field. However, this is probably a false positive, as indicated by a close examination of the location of the inferior temporal blood vessels (red arrow in panel A) in this eye to the average location in a group of patients (purple arrow in panel B), as well as the abnormally thick RNFL in the temporal quadrant. The repeat visual fields (VFs) are consistent with this interpretation. On the other hand, the presence of a hole (black arrow in panel A) suggests that there may be very early glaucomatous damage in the superior disc.

References

    1. Zangwill LM, Bowd C. Retinal nerve fiber layer analysis in the diagnosis of glaucoma. Curr Opin Ophthalmol 2006;17:120–31. - PubMed
    1. Lin SC, Singh K, Jampel HD, et al. Optic nerve head and retinal nerve fiber layer analysis: a report by the American Academy of Ophthalmology. Ophthalmology 2007;114:1937–49. - PMC - PubMed
    1. Chang R, Budenz DL. New developments in optical coherence tomography for glaucoma. Curr Opin Ophthalmol 2008;19:127–35. - PubMed
    1. Sharma P, Sample PA, Zangwill LM, et al. Diagnostic tools for glaucoma detection and management. Surv Ophthalmol 2008;53:17–32. - PMC - PubMed
    1. Huang D, Swanson EA, Lin CP, et al. Optical coherence tomography. Science 1991;254:1178–81. - PMC - PubMed

Publication types