

Optical coherence tomography imaging of macular oedema
- PMID: 24934220
- PMCID: PMC4208347
- DOI: 10.1136/bjophthalmol-2014-305305
Optical coherence tomography imaging of macular oedema
Abstract
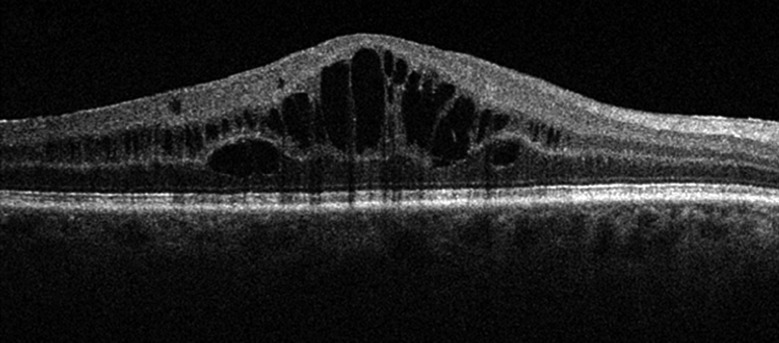
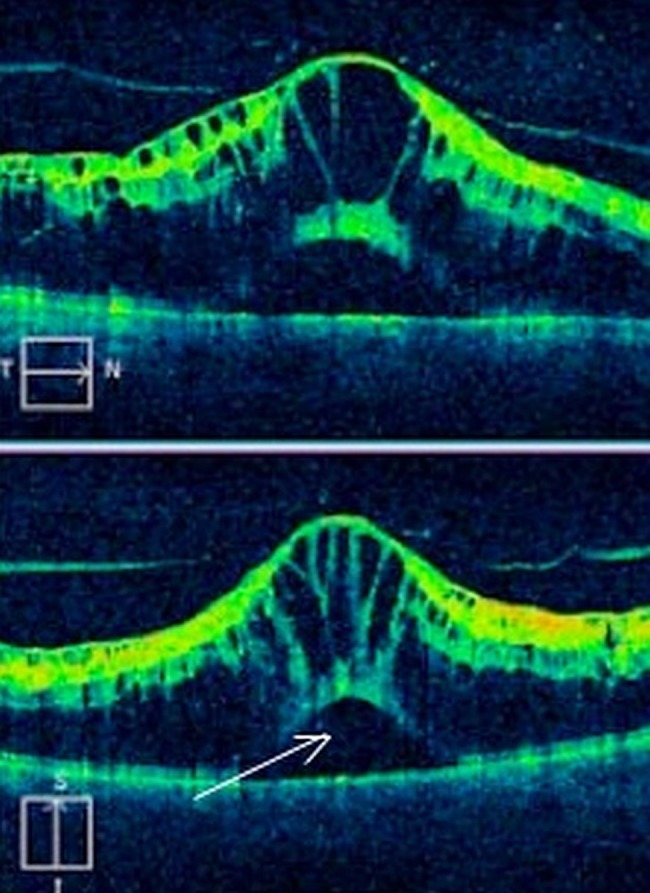
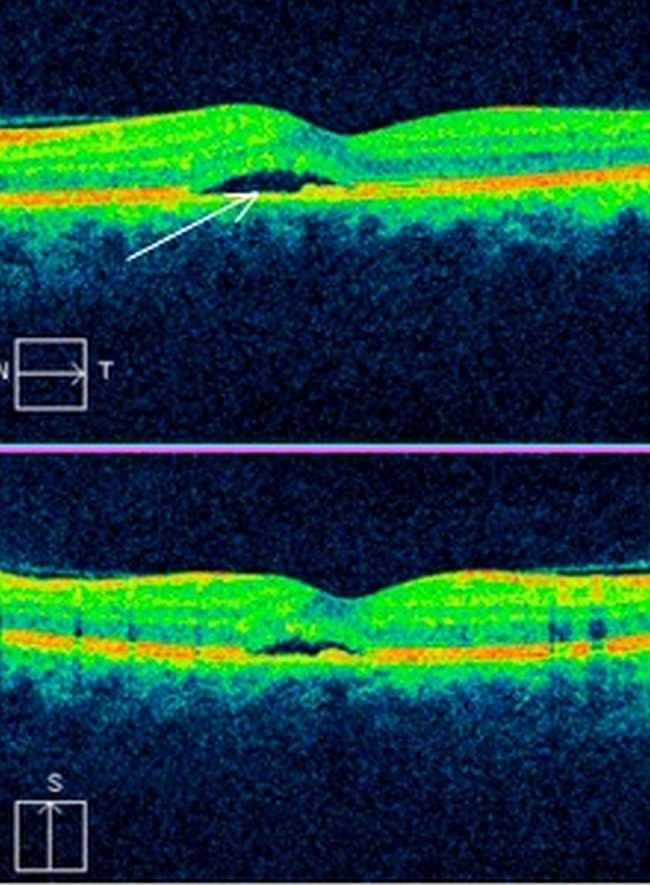
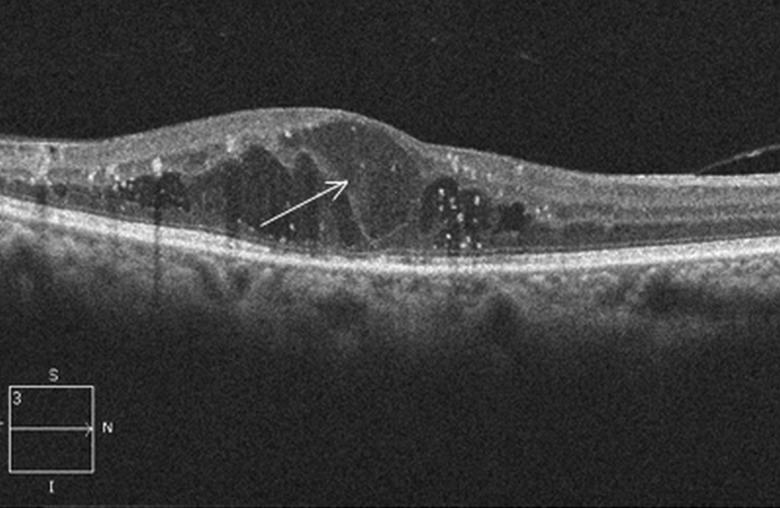
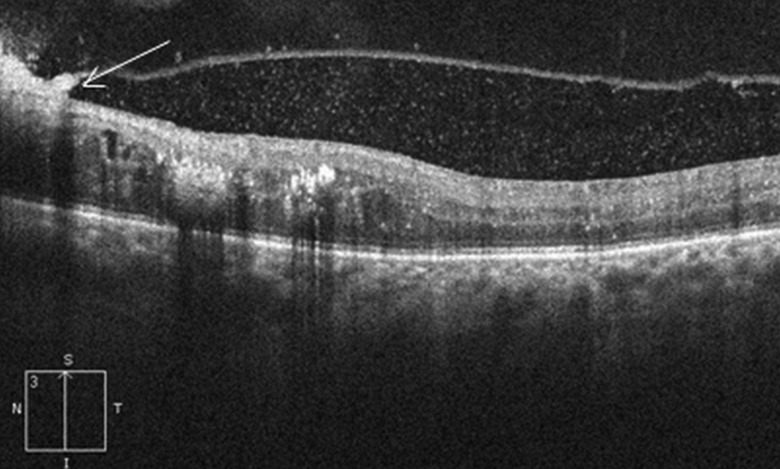
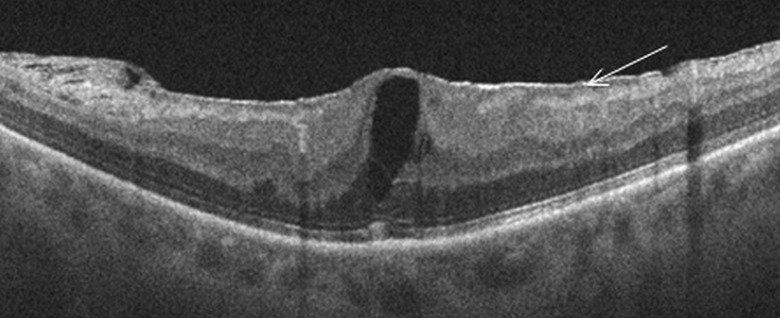
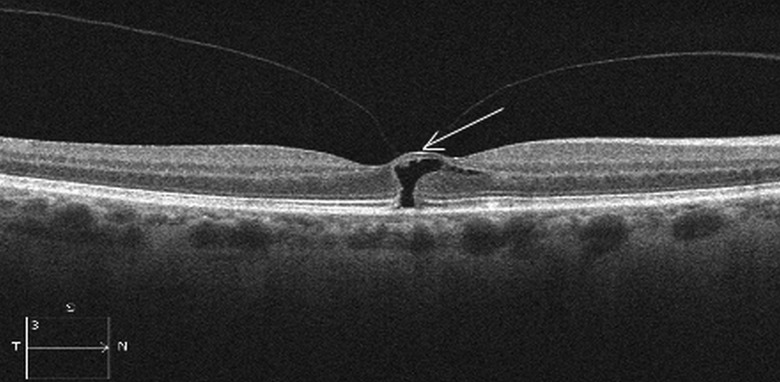
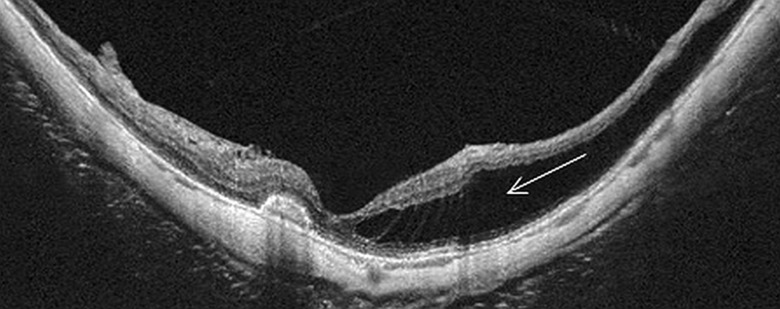
Macular oedema (ME) occurs in a wide variety of pathological conditions and accounts for different degrees of vision loss. Early detection of ME is therefore critical for diagnosis and therapeutic management. Optical coherence tomography (OCT) is a non-contact, diagnostic method that uses infrared light, which allows the analysis of the retinal structure by means of high-resolution tomographic cross sections. The identification, localisation, quantification and long-term follow-up of fluid collections are the most important capabilities of OCT. Since the introduction of OCT in clinical practice, it has become an invaluable diagnostic tool and different patterns of ME have been reported. The purpose of this manuscript is to review OCT profiles of ME according to the aetiology and describe what has been reported regarding intraretinal features in vivo.
Keywords: Imaging; Macula; Retina; Vitreous.
Published by the BMJ Publishing Group Limited. For permission to use (where not already granted under a licence) please go to http://group.bmj.com/group/rights-licensing/permissions.
Figures
References
-
- Puliafito CA, Hee MR, Lin CP, et al. Imaging of macular diseases with optical coherence tomography . Ophthalmology 1995;102:217–29. - PubMed
-
- Jaffe GJ, Caprioli J. Optical coherence tomography to detect and manage retinal disease and glaucoma. Am J Ophthalmol 2004;137:156–69. - PubMed
-
- Hirakawa H, Iijima H, Gohdo T, et al. Optical coherence tomography of cystoid macular edema associated with retinitis pigmentosa. Am J Ophthalmol 1999;128:185–91. - PubMed
Publication types
MeSH terms
LinkOut - more resources
Full Text Sources
Other Literature Sources