. 2014 Jul 15;86(14):6931-9.
doi: 10.1021/ac500734c. Epub 2014 Jun 25.

Interactive XCMS Online: simplifying advanced metabolomic data processing and subsequent statistical analyses

Affiliations

Interactive XCMS Online: simplifying advanced metabolomic data processing and subsequent statistical analyses

Harsha Gowda et al. Anal Chem. .

Abstract

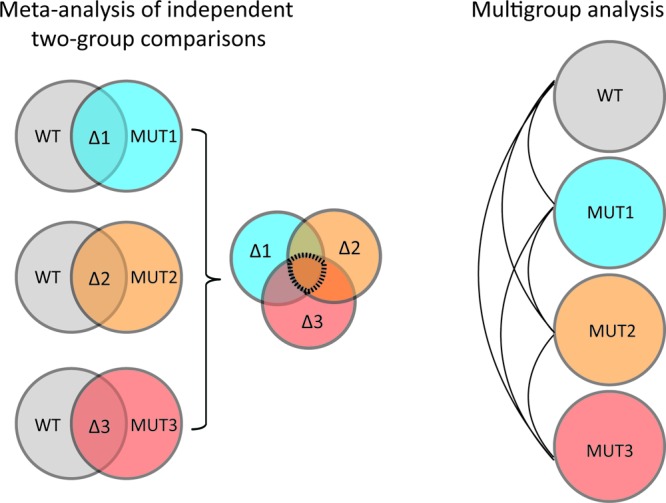
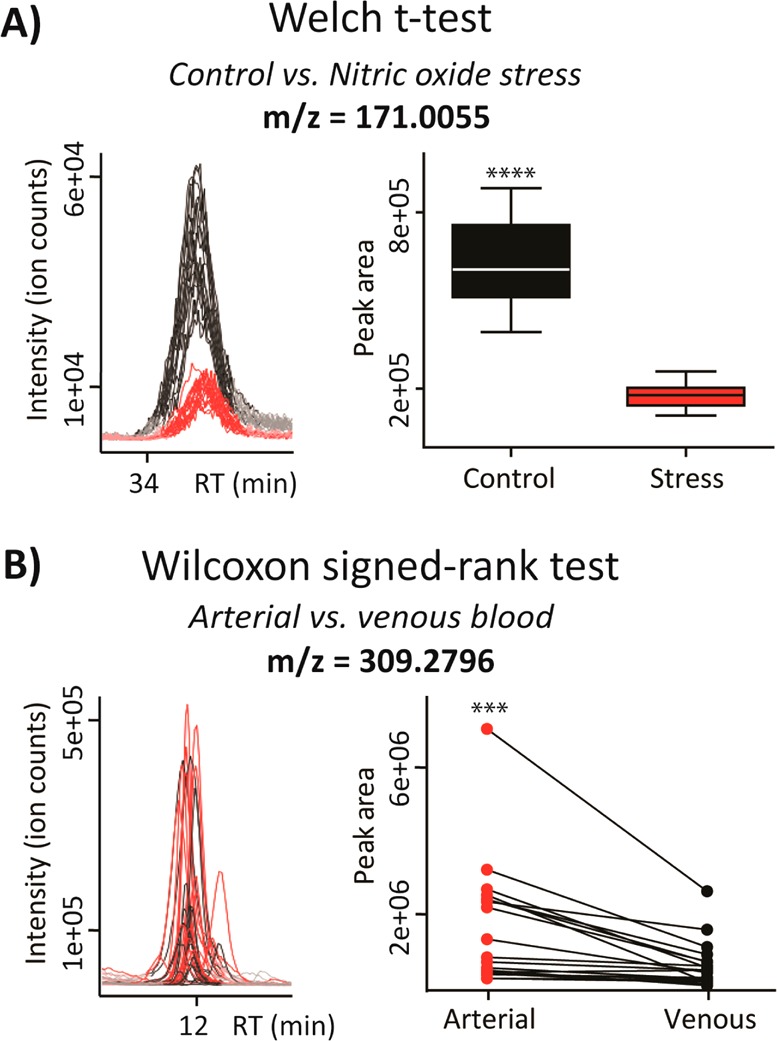
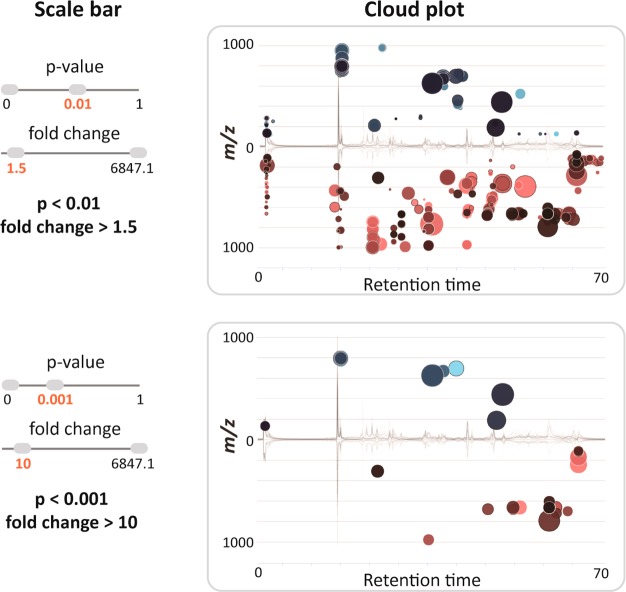
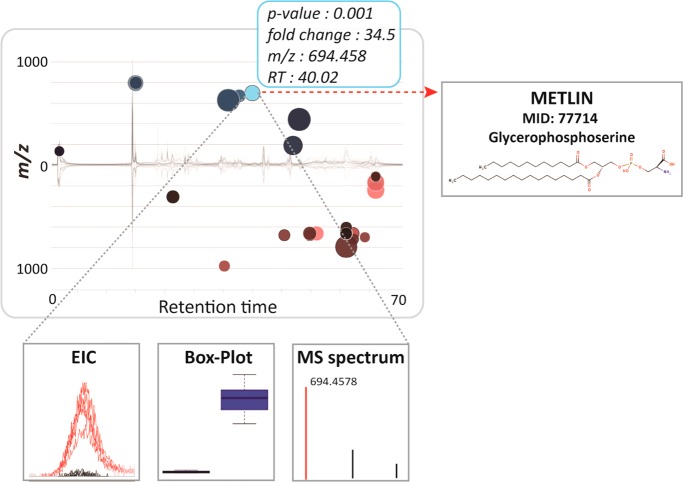
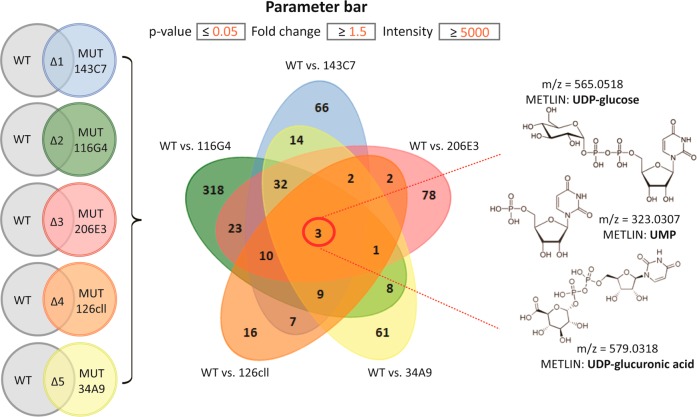
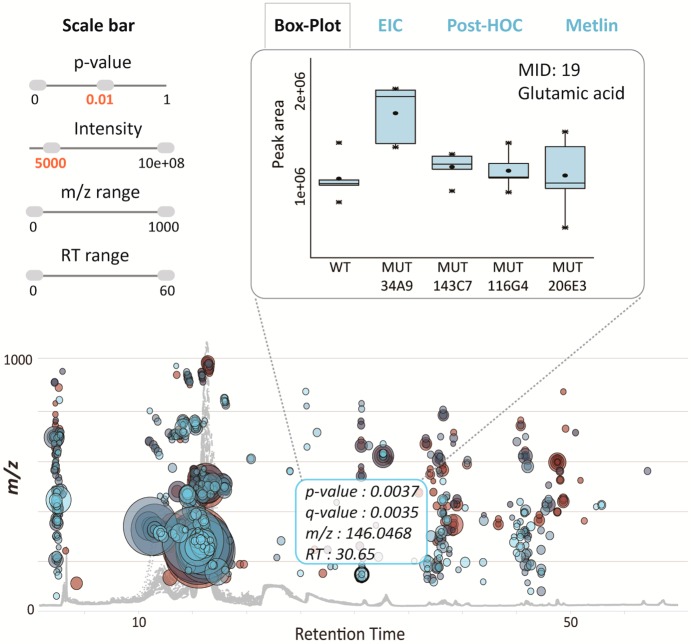
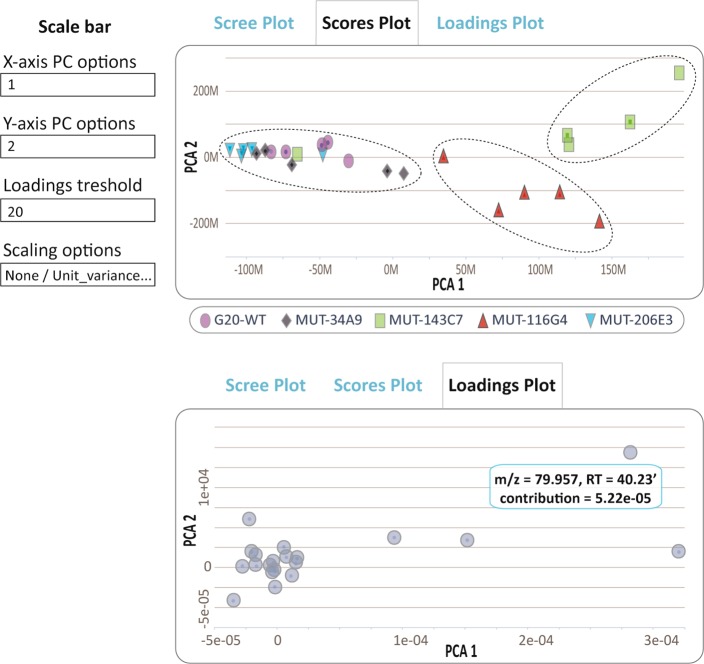
XCMS Online (xcmsonline.scripps.edu) is a cloud-based informatic platform designed to process and visualize mass-spectrometry-based, untargeted metabolomic data. Initially, the platform was developed for two-group comparisons to match the independent, "control" versus "disease" experimental design. Here, we introduce an enhanced XCMS Online interface that enables users to perform dependent (paired) two-group comparisons, meta-analysis, and multigroup comparisons, with comprehensive statistical output and interactive visualization tools. Newly incorporated statistical tests cover a wide array of univariate analyses. Multigroup comparison allows for the identification of differentially expressed metabolite features across multiple classes of data while higher order meta-analysis facilitates the identification of shared metabolic patterns across multiple two-group comparisons. Given the complexity of these data sets, we have developed an interactive platform where users can monitor the statistical output of univariate (cloud plots) and multivariate (PCA plots) data analysis in real time by adjusting the threshold and range of various parameters. On the interactive cloud plot, metabolite features can be filtered out by their significance level (p-value), fold change, mass-to-charge ratio, retention time, and intensity. The variation pattern of each feature can be visualized on both extracted-ion chromatograms and box plots. The interactive principal component analysis includes scores, loadings, and scree plots that can be adjusted depending on scaling criteria. The utility of XCMS functionalities is demonstrated through the metabolomic analysis of bacterial stress response and the comparison of lymphoblastic leukemia cell lines.


Figures

Figure 1
Figure 1
Scheme representing the experimental design of two-group comparison, meta-analysis, and multigroup analysis. Meta-analysis is a higher-order analysis that aims to identify shared metabolic patterns among multiple independent two-group comparisons. Shared dysregulated features are represented by the region at the center of the Venn diagram. In contrast, multigroup analysis aims to identify differences between groups and reveal the diversity of metabolic patterns across different groups: wt, bacterial wild type; mut, bacterial mutant.
Figure 2
Figure 2
Representative examples of independent and dependent (paired) two-group experimental design. Extracted ion chromatogram and box-plot/paired plot are shown for the features of interest. (A) A significantly down-regulated (p < 0.001) metabolite feature (m/z 171.005; METLIN MS/MS match, glycerol phosphate) in independent group design (control versus stressed bacterial population) was identified by using an independent parametric Welch t test. Welch’s t test is used to compare the means of two independent sample groups with the assumption that two-group variances may differ. (B) A significantly higher level (p < 0.001) of metabolite feature (m/z 309.279; METLIN hit, eicosenoic acid) in arterial blood plasma was determined by a paired nonparametric Wilcoxon test. Wilcoxon signed-rank test is a nonparametric alternative to the paired t test used to compare the related samples.
Figure 3
Figure 3
Dynamically generated images of the interactive cloud plot based on user-specified thresholds for p-value and fold change. The plot was generated for an untargeted experiment comparing lymphoblastic leukemia cell lines (Raji parental vs SUP-T1 parental line). Each bubble in the plot corresponds to a metabolite feature. Metabolite features are projected depending on their retention time (x-axis) and m/z (y-axis). The color of the bubble denotes directionality of fold change and the size of the bubble denotes the extent of the fold change. Statistical significance (p-value) is represented by the bubble’s color intensity. The features up-regulated in the SUP-T1 line compared to the Raji cell line are displayed in blue.
Figure 4
Figure 4
Interactive cloud plot with customized metabolomic data visualization. When a user scrolls the mouse over a bubble, feature assignments are displayed in a pop-up window (m/z, RT, p-value, fold change) with potential METLIN hits. Each bubble is linked to the METLIN database to provide putative identifications based on accurate m/z. When a bubble is selected by a mouse click, its EIC, box–whisker plot, and MS spectrum appear on the bottom of the main panel. The feature with m/z 694.458 and a putative METLIN hit for glycerophosphoserine (PS) seems to be specific to the SUP-T1 parental cell line.
Figure 5
Figure 5
Meta-analysis of the salt-stress response across five different mutant strains of Desulfovibrio alaskensis G20. The results of five two-group comparisons (left). Shared patterns of stress response are characterized by significant up-regulation (p < 0.01) of three metabolites displayed in the center of the Venn diagram (middle). The putative identity of those metabolites, verified by MS/MS matching to standards in METLIN, is shown on the right. Mutant annotations: 143C7, transcriptional regulator (Cro/Cl family); 206E3, potassium uptake protein TrkA; 34A9, lysine 2,3-aminomutase; 126cll, beta-lysine N-acetyltransferase; 116G4, V-type ATPase (subunit J, trk1).
Figure 6
Figure 6
Interactive multigroup cloud plot with customized metabolomic data visualization. Metabolite features whose level varies significantly (p < 0.01) across wild-type and different mutants are projected on the cloud plot depending on their retention time (x-axis) and m/z (y-axis). Each metabolite feature is represented by a bubble. Statistical significance (p-value) is represented by the bubble’s color intensity. The size of the bubble denotes feature intensity. When the user scrolls the mouse over a bubble, feature assignments are displayed in a pop-up window (m/z, RT, p-value, fold change). When a bubble is selected by a “mouse click”, the EIC, Box-Whisker plot, Posthoc, and METLIN hits appear on the main panel. Each bubble is linked to the METLIN database to provide putative identifications based on accurate m/z. The variation pattern of glutamic acid (m/z 146.0468, MS/MS METLIN match) across different mutants is shown by a box–whisker plot.
Figure 7
Figure 7
Interactive principal component analysis. A Scores plot showing the correlation between the samples (top panel) and a Loadings plot showing the relationship between the metabolite features that relate to the sample grouping (bottom panel). The clusters represent wild type and different mutant strains of Desulfovibrio alaskensis G20 (WT: wild type; MUT: mutant). The annotations for different mutant strains are given in the legend of Figure 5. The user has the option to set the loadings threshold and to apply different scaling criteria.

References

    1. Tautenhahn R.; Patti G. J.; Rinehart D.; Siuzdak G. Anal. Chem. 2012, 84, 5035–5039. - PMC - PubMed
    1. Wikoff W. R.; Pendyala G.; Siuzdak G.; Fox H. S. J. Clin. Invest. 2008, 118, 2661–2669. - PMC - PubMed
    1. Wikoff W. R.; Anfora A. T.; Liu J.; Schultz P. G.; Lesley S. A.; Peters E. C.; Siuzdak G. Proc. Natl. Acad. Sci. U. S. A. 2009, 106, 3698–3703. - PMC - PubMed
    1. Vinayavekhin N.; Homan E. A.; Saghatelian A. ACS Chem. Biol. 2010, 5, 91–103. - PubMed
    1. Smith C. A.; Want E. J.; O’Maille G.; Abagyan R.; Siuzdak G. Anal. Chem. 2006, 78, 779–787. - PubMed

Publication types