Clinical Trial
. 2014 Jun 30;211(7):1465-83.
doi: 10.1084/jem.20122192. Epub 2014 Jun 16.

CNS myelin induces regulatory functions of DC-SIGN-expressing, antigen-presenting cells via cognate interaction with MOG

Affiliations
Clinical Trial

CNS myelin induces regulatory functions of DC-SIGN-expressing, antigen-presenting cells via cognate interaction with MOG

J J García-Vallejo et al. J Exp Med. .

Abstract

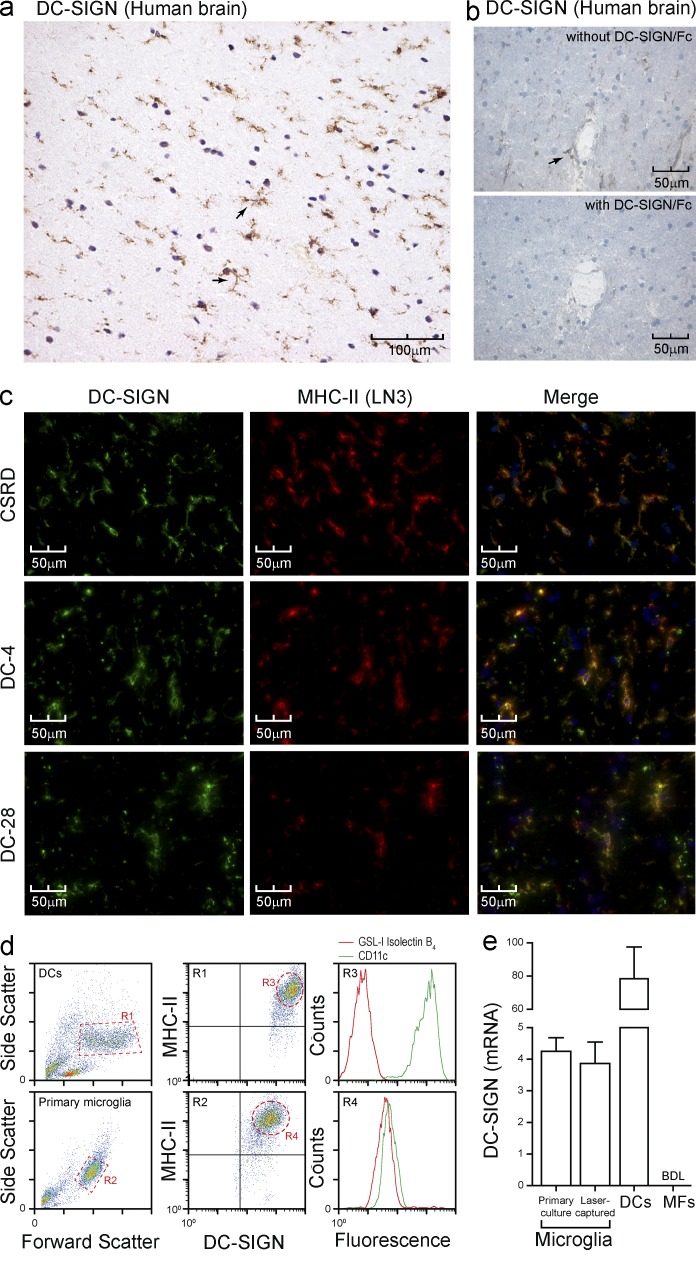
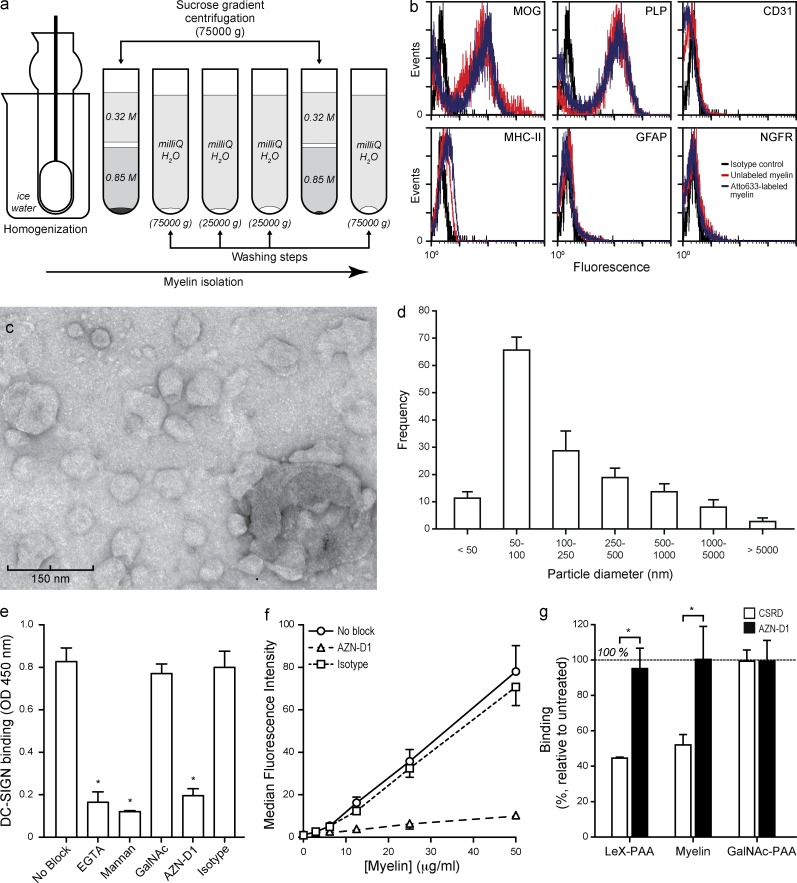
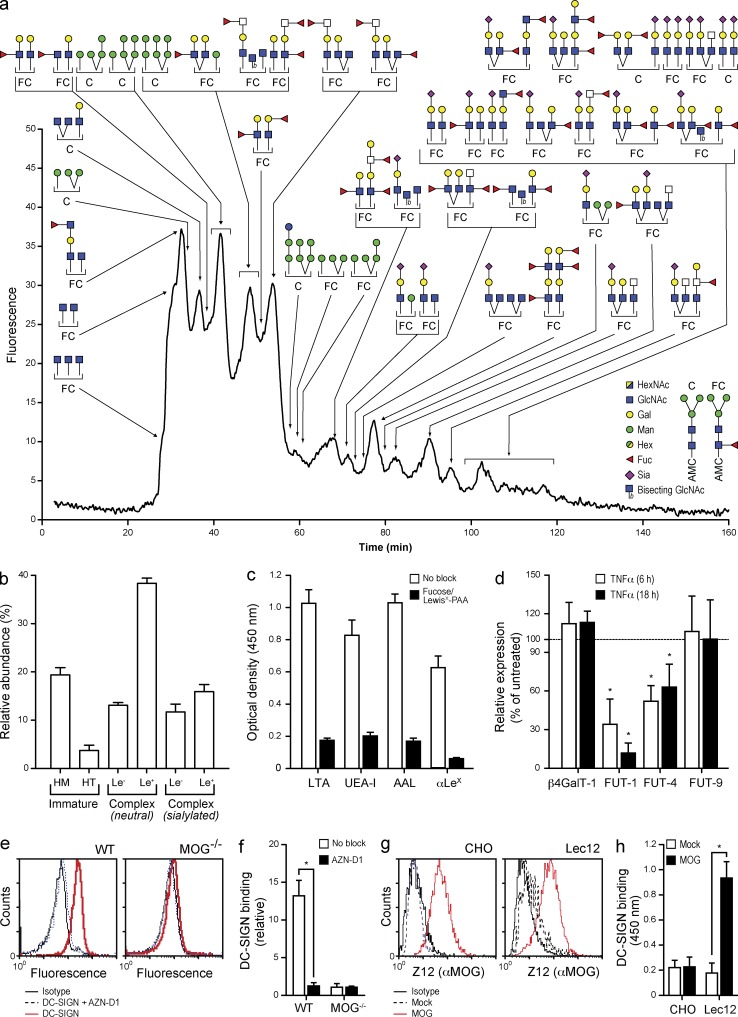
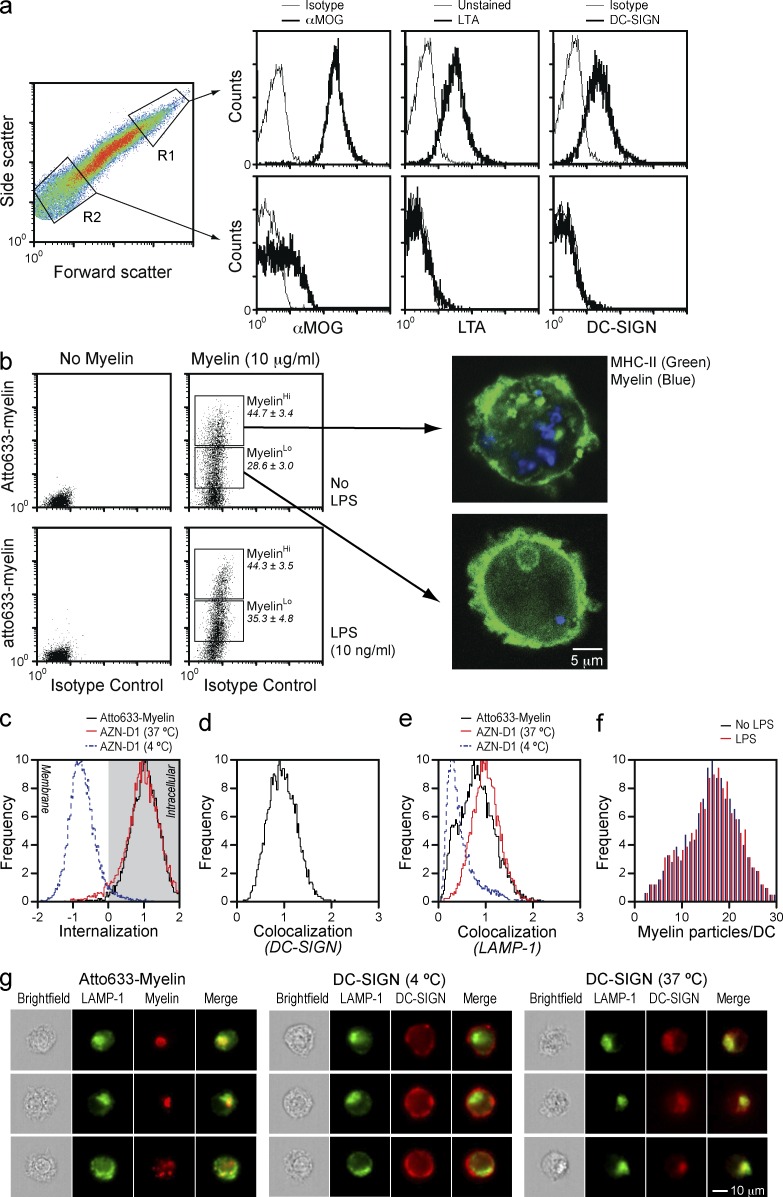
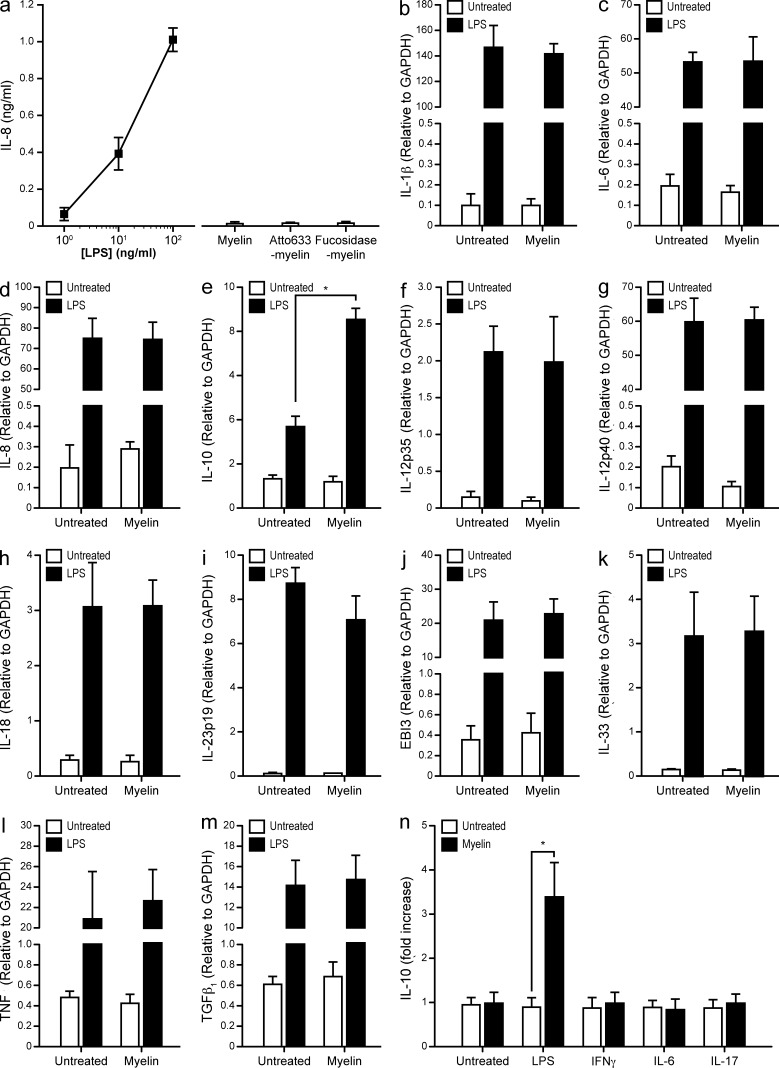
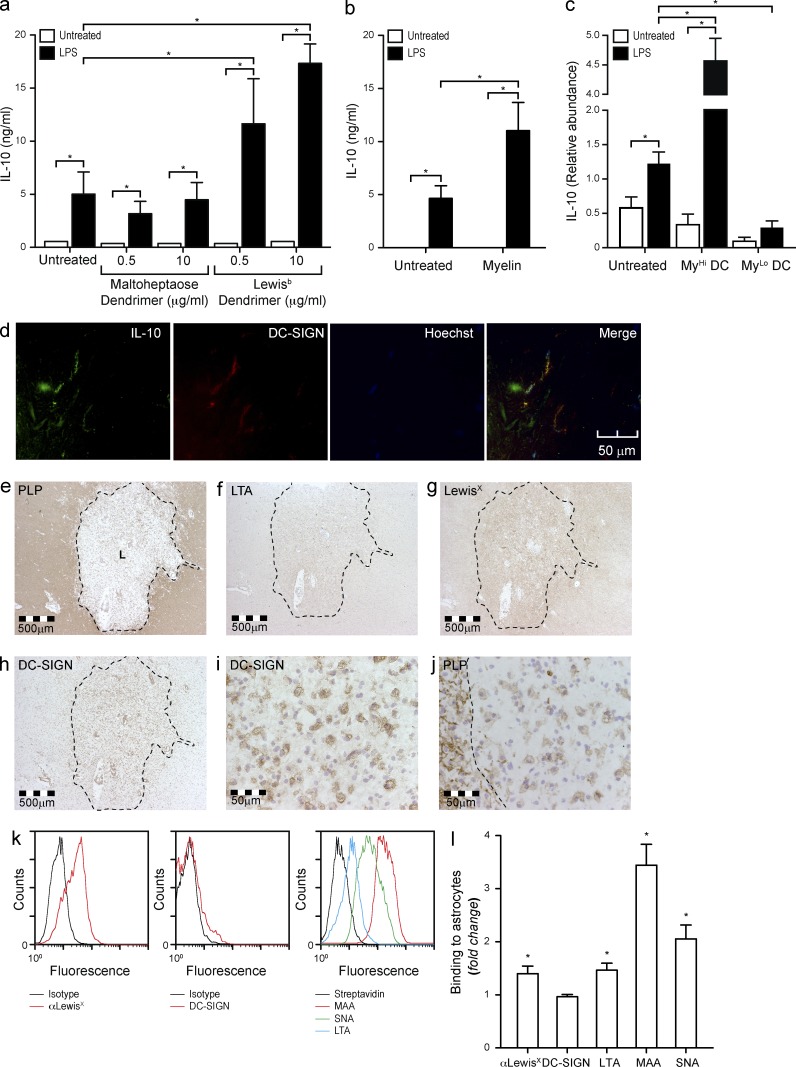
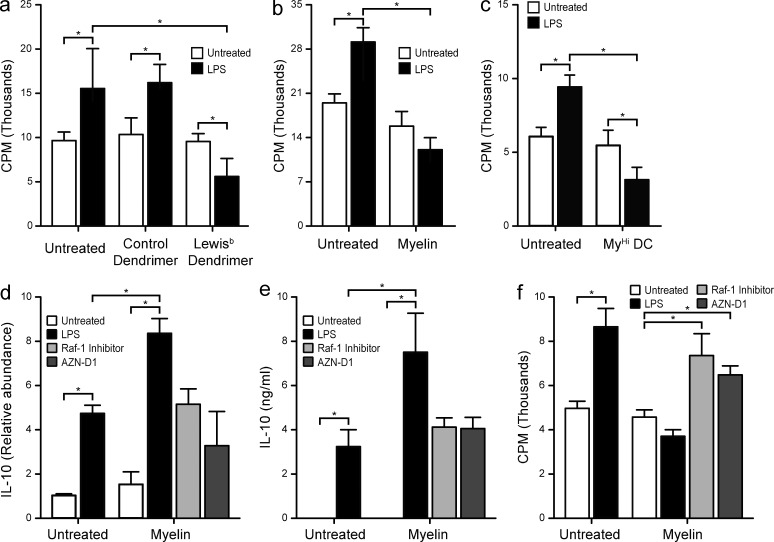
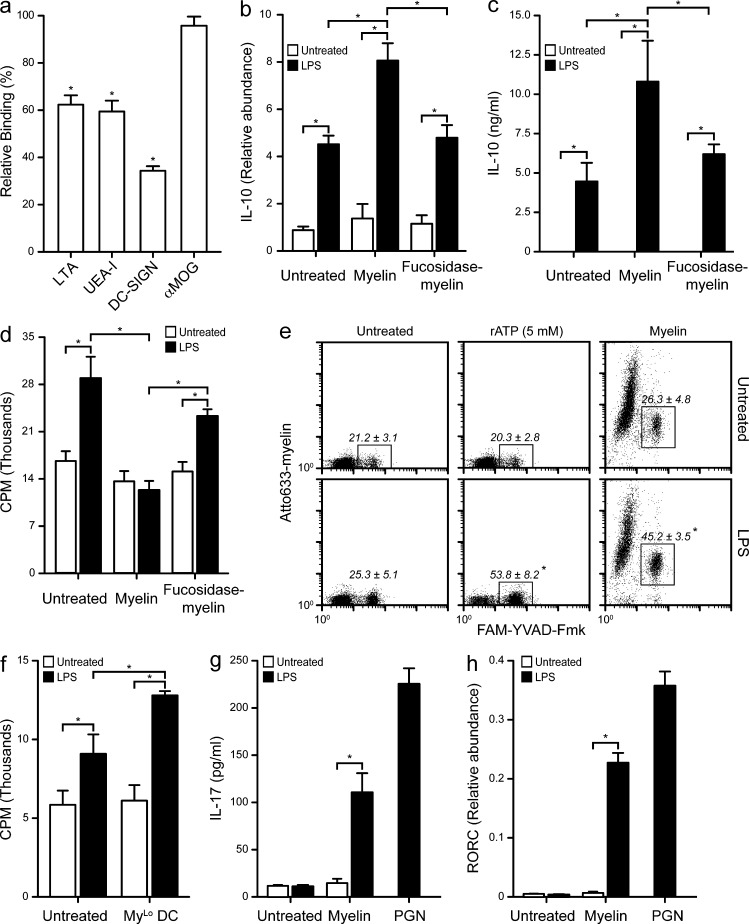
Myelin oligodendrocyte glycoprotein (MOG), a constituent of central nervous system myelin, is an important autoantigen in the neuroinflammatory disease multiple sclerosis (MS). However, its function remains unknown. Here, we show that, in healthy human myelin, MOG is decorated with fucosylated N-glycans that support recognition by the C-type lectin receptor (CLR) DC-specific intercellular adhesion molecule-3-grabbing nonintegrin (DC-SIGN) on microglia and DCs. The interaction of MOG with DC-SIGN in the context of simultaneous TLR4 activation resulted in enhanced IL-10 secretion and decreased T cell proliferation in a DC-SIGN-, glycosylation-, and Raf1-dependent manner. Exposure of oligodendrocytes to proinflammatory factors resulted in the down-regulation of fucosyltransferase expression, reflected by altered glycosylation at the MS lesion site. Indeed, removal of fucose on myelin reduced DC-SIGN-dependent homeostatic control, and resulted in inflammasome activation, increased T cell proliferation, and differentiation toward a Th17-prone phenotype. These data demonstrate a new role for myelin glycosylation in the control of immune homeostasis in the healthy human brain through the MOG-DC-SIGN homeostatic regulatory axis, which is comprised by inflammatory insults that affect glycosylation. This phenomenon should be considered as a basis to restore immune tolerance in MS.


Figures

Figure 1.
Figure 1.
DC-SIGN is expressed on microglia. (a) Frozen healthy human brain sections were stained for DC-SIGN with the polyclonal antibody CSRD and imaged by immunohistochemistry. Arrows highlight typical microglia features (representative of n > 7 donors). (b) Frozen healthy human brain sections were stained for DC-SIGN with CSRD with or without recombinant DC-SIGN and imaged by immunohistochemistry. The arrow highlights a perivascular macrophage (representative of n > 7 donors). (c) Frozen healthy human brain sections were stained for DC-SIGN (green) and MHC-II (red) and imaged by immunofluorescence microscopy. Three different anti–DC-SIGN antibodies were used: CSRD (polyclonal), DC-4 and DC-28 (mAbs against the stalk region; representative of n > 7 donors). (d) Primary microglia were isolated from a brain biopsy; stained for DC-SIGN, MHC-II, CD11c, and GSL-I Isolectin B4; and analyzed by FACS. DCs were analyzed in parallel for comparison (representative of triplicate determination). (e) DC-SIGN transcripts were quantified by real time RT-PCR after laser-capture microdissection of MHC-II+ cells from frozen normal brain sections (pool of 3 donors) and primary microglia as in d. Data are the mean ± SD (n = 3 independent experiments). BDL, below detection limit.
Figure 2.
Figure 2.
Characterization of human myelin. (a) Myelin was prepared by homogenization of fresh human white matter and sucrose gradient centrifugation, as indicated in the scheme. (b) The resulting myelin particles were characterized by FACS using microglial (MOG and PLP), endothelial (CD31), microglial (MHC-II), astrocytic (GFAP) or neuronal (NGFR) markers (representative of n > 3 donors). (c) Transmission electron micrograph of myelin particles (representative of n > 3 donors). (d) The diameter of 100 myelin particles was measured in 10 different micrographs. Data are the mean ± SD (n = 3 independent experiments). (e) Myelin was coated on to ELISA plates and the binding of DC-SIGN measured by a DC-SIGN–binding assay as described in the Materials and methods. *, P ≤ 0.05 (Mann-Whitney U test). Data are the mean ± SD (n = 3 independent experiments). (f) Binding of a titration of atto633-labeled myelin to DC-SIGN–expressing DCs was measured by FACS. Data are the mean ± SD (n = 3 independent experiments). (g) DCs were incubated with myelin (10 µg/ml), the DC-SIGN ligand PAA-LeX (10 µg/ml), or the MGL-ligand PAA-GalNAc (10 µg/ml), washed, and fixated. Binding of the DC-SIGN–specific antibodies AZN-D1 (mAb against carbohydrate-recognition domain) and CSRD (polyclonal against C terminus) was determined by FACS. Data are shown as the mean ± SD (n = 3 independent experiments).
Figure 3.
Figure 3.
Myelin is rich in N-glycans carrying DC-SIGN–binding carbohydrates. (a) N-glycans were enzymatically released, purified, fluorescently labeled, and profiled by LC-MS. Data are representative of the profiles of three myelin preparations. (b) The relative distribution of the main categories of N-glycans; high-mannose (HM), hybrid-type (HT), and Lewis antigen (Le) containing complex type N-glycans, was determined in three myelin preparations. Data are shown as the mean ± SD (n = 3 independent experiments). (c) Myelin was coated on to plates and the binding of the fucose-specific plant lectins Lotus tetragonolobus (LTA) Ulex europaeus (UEA-I), and Aleuria aurantia (AAL) agglutinins, and a LewisX-specific mAb was measured by ELISA. Data are shown as the mean ± SD (n = 3 independent experiments). (d) Primary oligodendrocytes were freshly isolated from rhesus macaques and cultured in the presence of TNF (100 IU/ml) for up to 18 h. The expression levels of the glycosyltransferases involved in the synthesis of Lewis-type epitopes were determined by real time PCR. *, P ≤ 0.05 (Mann-Whitney U test). Data are shown as the mean ± SD (n = 3 independent experiments). (e and f) The binding of DC-SIGN to myelin from WT or MOG−/− C57Bl6 mice was determined by FACS. (g) Representative of three independent experiments. (h) Mean ± SD of the relative binding. *, P ≤ 0.05 (Mann-Whitney U test; n = 3 independent experiments). (g) A human full-length MOG construct was expressed on CHO cells or a glycosylation mutant (Lec12). The expression of MOG was verified by FACS using the mAb Z12. Representative of three independent experiments. (h) MOG was captured on Z12-coated plates and DC-SIGN binding was assessed by ELISA. Data are shown as the mean ± SD. *, P ≤ 0.05 (Mann-Whitney U test; n = 3 independent experiments).
Figure 4.
Figure 4.
DC-SIGN mediates internalization and endolysosomal routing of large myelin particles. (a) Myelin particles were gated into large (R1) and small (R2) myelin particles and the level of MOG, and the presence of Lotus tetragonolobus agglutinin (LTA)-reactive structures (fucosylated glycans) and DC-SIGN ligands were addressed. Data are representative of three independent experiments. Thick lines represent cells stained with αMOG, the LTA lectin, or soluble DC-SIGN, whereas thin lines represent the corresponding isotype or unstained controls. (b) DCs were exposed to atto633-labeled myelin (10 µg/ml) for 1 h in the presence or absence of the TLR4 ligand LPS (10 ng/ml) and washed, and then the binding and uptake of myelin was measured by FACS. Myelin uptake defined two DC populations, MyHi and MyLo, which were subsequently stained for MHC-II (green) and investigated by confocal microscopy (blue, myelin). Data are representative of three independent experiments. (c) DCs were exposed to atto633-labeled myelin (10 µg/ml) for 1 h and the internalization of myelin in MyHi DCs was determined by imaging flow cytometry. As control, DCs incubated at 4 or 37°C with the DC-SIGN–blocking antibody AZN-D1 (10 µg/ml) were used. Data are based on at least 5,000 cells. Results are representative of three independent experiments. (d) DCs were exposed to atto633-labeled myelin (10 µg/ml) for 5 min, stained for DC-SIGN with the CSRD antibody, and tested for co-localization by imaging flow cytometry. Data are based on at least 5,000 cells. Results are representative of three independent experiments. (e) DCs were exposed to atto633-labeled myelin (10 µg/ml) for 1 h, stained for the lysosomal marker LAMP-1, and tested for colocalization by imaging flow cytometry. As control, DCs incubated at 4 or 37°C with AZN-D1 (10 µg/ml) were used. Data are based on at least 5,000 cells. Results are representative of three independent experiments. (f) DCs were incubated with atto633-labeled myelin (10 µg/ml) for 1 h in the presence or absence of LPS (10 ng/ml) and acquired by imaging flow cytometry. A mask was designed to detect myelin particles and the number of myelin particles per cell was counted. Data are based on at least 5,000 cells. Results are representative of three independent experiments. (g) Representative images demonstrating the co-localization of myelin with LAMP-1 as described in e.
Figure 5.
Figure 5.
Myelin enhances the LPS-mediated expression of IL-10 by DCs. (a) HEK-TLR4 cells were exposed to different preparations of myelin (10 µg/ml) and assayed for IL-8 production by ELISA. A titration of LPS was used as positive control. Data are shown as the mean ± SD (n = 3 independent experiments). (b–m) DCs were exposed to myelin (10 µg/ml) with or without LPS (10 ng/ml) for 6 h and analyzed by real-time PCR for the expression of IL-1β (b), IL-6 (c), IL-8 (d), IL-10 (e), IL-12p35 (f), IL-12p40 (g), IL-18 (h), IL-23p19 (i), EBI3 (j), IL-33 (k), TNF (l), and TGFβ (m). *, P ≤ 0.05 (Mann-Whitney U test). Data are shown as the mean the mean ± SD (n = 7 independent experiments). (n), DCs were exposed to myelin (10 µg/ml) with or without LPS (10 ng/ml), IFNγ (1,000 IU/ml), IL-6 (100 IU/ml), or IL-17 (100 IU/ml) for 6 h. The expression levels of IL-10 were determined by real time PCR. *, P ≤ 0.05 (Mann-Whitney U test). Data are presented as the mean ± SD of the fold increase versus the corresponding stimulus (n = 3 independent experiments).
Figure 6.
Figure 6.
Simultaneous DC-SIGN and TLR4 triggering enhances IL-10 production. (a) DCs were incubated overnight with Lewisb-containing glycodendrimers (10 µg/ml) or a mock control (maltoheptaose dendrimer, 10 µg/ml) in the presence or absence of LPS (10 ng/ml). Supernatants were assayed for IL-10 secretion by ELISA. *, P ≤ 0.05 (Mann-Whitney U test). Data are shown as the mean ± SD (n = 6 independent experiments). (b) DCs were incubated overnight with myelin (10 µg/ml) with or without LPS (10 ng/ml). Supernatants were harvested and assayed for IL-10 secretion by ELISA. *, P ≤ 0.05 (Mann-Whitney U test). Data are shown as the mean ± SD (n = 6 independent experiments). (c) DCs were incubated for 6 h with atto633-labeled myelin (10 µg/ml) in the presence or absence of LPS (10 ng/ml). DCs were then sorted according to the amount of myelin ingested into MyHi and MyLo DCs and lysed for mRNA isolation. The expression levels of IL-10 were determined by real-time PCR. *, P ≤ 0.05 (Mann-Whitney U test). Data are shown as the mean ± SD (n = 3 independent experiments). (d) Frozen healthy human brain sections were stained for DC-SIGN and IL-10 and imaged by confocal microscopy (representative of n = 3 donors). (e–j) Consecutive brain sections from a MS patient were stained with for PLP, fucosylated glycans (LTA, αLeX), and DC-SIGN and imaged by standard microscopy (representative of 7 donors). The MS lesion (L) is highlighted with a dotted line. (k) Primary human astrocytes were stained for LewisX, and the binding of soluble DC-SIGN and the lectins MAA, SNA, and LTA was investigated by FACS (representative of three experiments). (l) Primary human astrocytes were cultured in the presence of TNF (100 IU/ml) and IFN-γ (1,000 IU/ml) for 48 h. The expression of LewisX and the binding of soluble DC-SIGN and the lectins LTA, MAA, and SNA was addressed by FACS. *, P ≤ 0.05 (Mann-Whitney U test). Data are shown as the mean ± SD of the fold increase versus the untreated sample (n = 3 experiments).
Figure 7.
Figure 7.
Simultaneous DC-SIGN and TLR4 triggering decreases allogeneic T cell proliferation. (a) DCs were pulsed with Lewisb-containing glycodendrimers (10 µg/ml) or a mock control (maltoheptaose dendrimer, 10 µg/ml) in the presence or absence of LPS (10 ng/ml) and exposed to allogeneic naive CD4+ T cells. T cells were allowed to rest, and then restimulated with LPS-matured DCs. T cell proliferation was measured by 3[H]thymidine incorporation. *, P ≤ 0.05 (Mann-Whitney U test). Data are shown as the mean ± SD (n = 5 independent experiments). (b) DCs were pulsed with myelin (10 µg/ml) in the presence or absence of LPS (10 ng/ml) and exposed to allogeneic naive CD4+ T cells. T cells were allowed to rest, and then restimulated with LPS-matured DCs. T cell proliferation was measured by 3[H]thymidine incorporation. *, P ≤ 0.05 (Mann-Whitney U test). Data are shown as the mean ± SD (n = 5 independent experiments). (c) DCs were pulsed with atto633-labeled myelin (10 µg/ml) in the presence or absence of LPS (10 ng/ml) for 1 h and sorted according to their myelin content. MyHi DCs were exposed to allogeneic naive CD4+ T cells. T cells were allowed to rest and then restimulated with LPS-matured DCs. T cell proliferation was measured by 3[H]thymidine incorporation. *, P ≤ 0.05 (Mann-Whitney U test). Data are shown as the mean ± SD (n = 3 independent experiments). Only 1:25 DC/T cell ratios are shown; 1:50, 1:100, and 1:200 ratios showed essentially the same trend. (d) DCs were incubated 6 h with myelin (10 µg/ml) in the presence or absence of LPS (10 ng/ml) and the Raf-1 kinase inhibitor GW5074 (20 µM) or the blocking anti–DC-SIGN antibody AZN-D1 (20 µg/ml). DCs were then lysed for mRNA isolation and the expression levels of IL-10 were assayed by real time PCR. *, P ≤ 0.05 (Mann-Whitney U test). Data are shown as the mean ± SD (n = 3 independent experiments). (e) DCs were incubated for 18 h with myelin (10 µg/ml) in the presence or absence of LPS (10 ng/ml) and the Raf-1 kinase inhibitor GW5074 (20 µM) or the blocking anti–DC-SIGN antibody AZN-D1 (20 µg/ml). Supernatants were harvested and assayed for IL-10 secretion by ELISA. *, P ≤ 0.05 (Mann-Whitney U test). Data are shown as the mean ± SD (n = 3 independent experiments). (f) DCs were pulsed with myelin (10 µg/ml) in the presence or absence of LPS (10 ng/ml) and the Raf-1 kinase inhibitor GW5074 (20 µM) or the blocking anti–DC-SIGN antibody AZN-D1 (20 µg/ml), and exposed to allogeneic naive CD4+ T cells. T cells were allowed to rest and then restimulated with LPS-matured DCs. T cell proliferation was measured by 3[H]thymidine incorporation. *, P ≤ 0.05 (Mann-Whitney U test). Data are shown as the mean ± SD (n = 5 independent experiments). Only 1:25 DC/T cell ratios are shown; 1:50, 1:100, and 1:200 ratios showed essentially the same trend.
Figure 8.
Figure 8.
Defucosylated or small myelin particles are proinflammatory. (a) Myelin was defucosylated using bovine kidney α(1–2, 3, 4, 6)-Fucosidase. Defucosylation was verified by assaying the binding of the fucose specific plant lectins Lotus tetragonolobus (LTA) and Ulex europaeus (UEA-I) agglutinins, as well as the binding of recombinant DC-SIGN and the presence of MOG using the Z12 antibody on myelin (2 µg/ml) coated plates. (b) DCs were incubated 6 h with myelin (10 µg/ml) or defucosylated myelin (10 µg/ml) in the presence or absence of LPS (10 ng/ml). DCs were then lysed for mRNA isolation and the expression levels of IL-10 assayed by real-time PCR. *, P ≤ 0.05 (Mann-Whitney U test). Data are shown as the mean ± SD (n = 3 independent experiments). (c) DCs were incubated 18 h with myelin (10 µg/ml) or defucosylated myelin (10 µg/ml) in the presence or absence of LPS (10 ng/ml). Supernatants were harvested and assayed for IL-10 secretion by ELISA. *, P ≤ 0.05 (Mann-Whitney U test). Data are shown as the mean ± SD (n = 3 independent experiments). (d) DCs were pulsed with myelin (10 µg/ml) or defucosylated myelin (10 µg/ml), with or without LPS (10 ng/ml), and exposed to allogeneic naive CD4+ T cells. T cells were allowed to rest and then restimulated with LPS-matured DCs. T cell proliferation was measured by 3[H]thymidine incorporation. *, P ≤ 0.05 (Mann-Whitney U test). Data are shown as the mean ± SD (n = 5 independent experiments). Only 1:25 DC/T cell ratios are shown; 1:50, 1:100, and 1:200 ratios showed essentially the same trend. (e) DCs were incubated with myelin (10 µg/ml) in the presence or absence of LPS (10 ng/ml). Caspase-1 activation was measured by FACS using the fluorescent caspase-1 inhibitor Fam-YVAD-Fmk. rATP (5 mM) was used as positive control for inflammasome activation. Representative dot plots of experiments (n = 3) performed in duplicate are shown. The mean ± SD of the gated regions in the three independent experiments are displayed. *, P ≤ 0.05 (Mann-Whitney U test). (f) DCs were pulsed with atto633-labeled myelin (10 µg/ml) with or without LPS (10 ng/ml) for 1 h and sorted according to myelin content. MyLo DCs were exposed to allogeneic naive CD4+ T cells. T cells were allowed to rest and then restimulated with LPS-matured DCs. T cell proliferation was measured by 3[H]thymidine incorporation. *, P ≤ 0.05 (Mann-Whitney U test). Data are shown as the mean ± SD (n = 3 independent experiments). Only 1:25 DC:T cell ratios are shown; 1:50, 1:100, and 1:200 ratios showed essentially the same trend. (g) DCs were pulsed with myelin (10 µg/ml) overnight and co-cultured with allogeneic memory CD4+ T cells. T cells were restimulated with IL-2 (104 IU/ml) twice over 2 wk and supernatants were assayed for IL-17 secretion by ELISA. Peptidoglycan (PGN; 10 µg/ml) was used as a positive control for Th17 skewing. *, P ≤ 0.05 (Mann-Whitney U test). Data are shown as the mean ± SD (n = 3 independent experiments). (h) T cells from g were lysed and their mRNA assayed for the relative abundance of RORC. *, P ≤ 0.05 (Mann-Whitney U test). Data are shown as the mean ± SD (n = 3 independent experiments).

References

    1. Appelmelk B.J., van Die I., van Vliet S.J., Vandenbroucke-Grauls C.M.J.E., Geijtenbeek T.B.H., van Kooyk Y. 2003. Cutting edge: carbohydrate profiling identifies new pathogens that interact with dendritic cell-specific ICAM-3-grabbing nonintegrin on dendritic cells. J. Immunol. 170:1635–1639 10.4049/jimmunol.170.4.1635 - DOI - PubMed
    1. Becher B., Segal B.M. 2011. T(H)17 cytokines in autoimmune neuro-inflammation. Curr. Opin. Immunol. 23:707–712 10.1016/j.coi.2011.08.005 - DOI - PMC - PubMed
    1. Birnberg T., Bar-On L., Sapoznikov A., Caton M.L., Cervantes-Barragán L., Makia D., Krauthgamer R., Brenner O., Ludewig B., Brockschnieder D., et al. 2008. Lack of conventional dendritic cells is compatible with normal development and T cell homeostasis, but causes myeloid proliferative syndrome. Immunity. 29:986–997 10.1016/j.immuni.2008.10.012 - DOI - PubMed
    1. Boven L.A., Van Meurs M., Van Zwam M., Wierenga-Wolf A., Hintzen R.Q., Boot R.G., Aerts J.M., Amor S., Nieuwenhuis E.E., Laman J.D. 2006. Myelin-laden macrophages are anti-inflammatory, consistent with foam cells in multiple sclerosis. Brain. 129:517–526 10.1093/brain/awh707 - DOI - PubMed
    1. Brynedal B., Wojcik J., Esposito F., Debailleul V., Yaouanq J., Martinelli-Boneschi F., Edan G., Comi G., Hillert J., Abderrahim H. 2010. MGAT5 alters the severity of multiple sclerosis. J. Neuroimmunol. 220:120–124 10.1016/j.jneuroim.2010.01.003 - DOI - PubMed

Publication types

MeSH terms