. 2014 Aug 15;289(33):22723-22738.
doi: 10.1074/jbc.M114.575050. Epub 2014 Jun 16.

Role of protein phosphatase 1 in dephosphorylation of Ebola virus VP30 protein and its targeting for the inhibition of viral transcription

Affiliations

Role of protein phosphatase 1 in dephosphorylation of Ebola virus VP30 protein and its targeting for the inhibition of viral transcription

Philipp A Ilinykh et al. J Biol Chem. .

Abstract

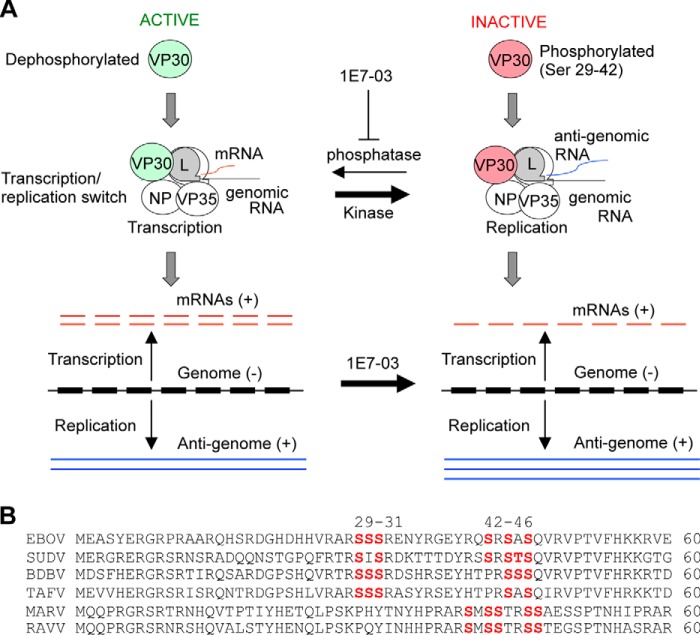
The filovirus Ebola (EBOV) causes the most severe hemorrhagic fever known. The EBOV RNA-dependent polymerase complex includes a filovirus-specific VP30, which is critical for the transcriptional but not replication activity of EBOV polymerase; to support transcription, VP30 must be in a dephosphorylated form. Here we show that EBOV VP30 is phosphorylated not only at the N-terminal serine clusters identified previously but also at the threonine residues at positions 143 and 146. We also show that host cell protein phosphatase 1 (PP1) controls VP30 dephosphorylation because expression of a PP1-binding peptide cdNIPP1 increased VP30 phosphorylation. Moreover, targeting PP1 mRNA by shRNA resulted in the overexpression of SIPP1, a cytoplasm-shuttling regulatory subunit of PP1, and increased EBOV transcription, suggesting that cytoplasmic accumulation of PP1 induces EBOV transcription. Furthermore, we developed a small molecule compound, 1E7-03, that targeted a non-catalytic site of PP1 and increased VP30 dephosphorylation. The compound inhibited the transcription but increased replication of the viral genome and completely suppressed replication of EBOV in cultured cells. Finally, mutations of Thr(143) and Thr(146) of VP30 significantly inhibited EBOV transcription and strongly induced VP30 phosphorylation in the N-terminal Ser residues 29-46, suggesting a novel mechanism of regulation of VP30 phosphorylation. Our findings suggest that targeting PP1 with small molecules is a feasible approach to achieve dysregulation of the EBOV polymerase activity. This novel approach may be used for the development of antivirals against EBOV and other filovirus species.

Keywords: Ebola Virus; Phosphoprotein Phosphatase 1 (PP1); Small Molecule; Transcription; Viral Replication.


Figures

FIGURE 1.
FIGURE 1.
EBOV VP30 has two clusters of phosphorylation. A, purification of FLAG-tagged VP30 for MS/MS analysis. FLAG-tagged VP30-expressing 293T cells were treated with 0.1 μm okadaic acid for 3 h. VP30 was immunoprecipitated, resolved on 10% SDS-PAGE, and stained with colloidal Coomassie Blue. Lane 1, molecular weight markers; lane 2, VP30; lane 3, mock-transfected control. The position of VP30 is shown by an arrow. B, MS/MS analysis of virion-associated and recombinant VP30, the SEQUEST search results. VP30 was in-gel-digested with trypsin, and the eluted peptides were subjected to MS analysis on a Thermo LTQ Orbitrap XL mass spectrometer. Peptides identified with high, median, and low probability are underscored with green, red, and blue lines, respectively; the thin and thick lines depict data for recombinant and virion-associated VP30, respectively. Peptides that were found to be phosphorylated in virion-associated and recombinant VP30 are overscored with brown and black lines, respectively. The positions of phosphorylated amino acids in recombinant and virion-associated VP30 are indicated with black and brown arrows, respectively. Note that threonines 143 and 146 were found to be phosphorylated in both virion-associated and recombinant VP30. C, MS/MS spectrum of the VP30 peptide 29–36. The colored peaks indicate matched MS/MS fragments. Green indicates precursors, as outlined in the figure; blue and red indicate y and a ions, respectively. The spectrum gives positive identification of SSSRENYR peptide with the indicated phosphorylation sites. D, MS/MS spectrum of the VP30 peptide 142–149. The colored peaks indicate matched MS/MS fragments (as described in C). The spectrum gives positive identification of the ITLLTLIK peptide with the indicated phosphorylation sites. E, electrophoretic separation of the purified EBOV for MS/MS analysis. EBOV was resolved in 10% SDS-PAGE and stained with colloidal Coomassie Blue. Lane 1, molecular weight markers; lane 2, proteins of purified inactivated EBOV. F, MS/MS analysis of the peptide 41–49 from the EBOV-incorporated VP30. The colored peaks indicate matched MS/MS fragments (as described in C). The spectrum gives positive identification of QSESASQVR with the indicated phosphorylation site.
FIGURE 2.
FIGURE 2.
EBOV VP30 is dephosphorylated by PP1. A, phosphorylation of EBOV VP30 is increased in the presence of okadaic acid. FLAG-tagged VP30 was expressed in 293T cells and metabolically labeled with [32P]orthophosphate with or without 0.1 μm okadaic acid (OA). VP30 was immunoprecipitated with anti-FLAG antibodies, resolved on 10% SDS-PAGE, and either exposed to a PhosphorImager screen (top) or probed for VP30 with anti-FLAG antibodies (bottom). The positions of VP30 are shown by arrows. B, PP1 inhibition induces VP30 phosphorylation: phosphorylation of EBOV VP30 in the presence of WT or the mutated non-active form of cdNIPP1. Top, FLAG-tagged VP30 and cdNIPP1-eGFP (WT or mutant) were expressed in 293T cells and metabolically labeled with [32P]orthophosphate. VP30 was immunoprecipitated, resolved on 10% SDS-PAGE, and either exposed to a PhosphorImager screen (top) or probed for VP30 with anti-FLAG antibodies (bottom). Bottom, averages of five independent experiments ± S.D. (error bars). The p value was calculated by Student's paired t test. C, expression of PP1α mRNA is reduced in PP1 KD cells. Concentrations of PP1 RNA in Vero-E6 cells stably transduced with vectors expressing control non-targeting shRNA or PP1α-targeting shRNA were determined by real-time RT-PCR with 18 S ribosomal RNA as an internal control. Shown are means of triplicate values ± S.D. The p value was calculated by Student's paired t test. D, VP30 phosphorylation is reduced in PP1 KD cells. FLAG-tagged VP30 was expressed in Vero-E6 cells untreated (WT) or stably transduced with non-targeting shRNA (Sh) or PP1α-targeting shRNA (KD). The cells were metabolically labeled with [32P]orthophosphate, and VP30 was immunoprecipitated with anti-FLAG antibodies, resolved on 10% SDS-PAGE, and either exposed to a PhosphorImager screen (top) or probed for VP30 with anti-FLAG antibodies (bottom). E, expression of SIPP1 is increased in PP1 KD Vero-E6 cells. Concentrations of the regulatory subunits of PP1 SIPP1, Sds22, and PNUTS were determined by real-time RT-PCR with 18 S ribosomal RNA as an internal control. Shown are means of triplicate values ± S.D. F, EBOV minigenome. Top, the EBOV genome; overlapping of some genes is shown; the EBOV-specific transcriptional gene-start and gene-end signals are highlighted in green and red, respectively. Left, the EBOV monocistronic minigenome used in the present experiment and the bicistronic minigenome used in the experiments shown in Fig. 7. The EBOV leader sequence, which includes the promoter, non-coding sequence, and gene-start, and the EBOV trailer sequence, including the gene-end and non-coding sequence, flank the firefly luciferase ORF in the monocistronic minigenome and flank the firefly and the Renilla luciferase ORFs in the bicistronic minigenome. Right, the support plasmids encoding the EBOV polymerase complex and T7 polymerase. Transcription was analyzed by luminometry; in addition, in the experiments shown in Fig. 7C, the minigenome was used for analysis of replication by Northern blotting. G, EBOV transcription is increased in PP1 KD cells. Transcription of the monocystronic minigenome in Vero-E6 cells stably transduced with vector expressing PP1α-targeting shRNA: the mean luciferase signals based on triplicate values ± S.E. The p value was calculated by Student's paired t test. WB, Western blot.
FIGURE 3.
FIGURE 3.
Effect of the PP1-targeting compounds on EBOV replication and VP30 phosphorylation. A, chemical structures of the compounds 1E7, 1E7-03, and 1E7-04. B, binding of PP1 to 1E7 analog in vitro. An analog of 1E7 containing an additional NH2 group was coupled with N-hydroxysuccinimide-Sepharose and incubated with PP1. The beads were treated with trypsin, and the eluted peptides were analyzed by nano-LC connected to an LTQ XL Orbitrap mass spectrometer. The PP1 peptide EIFLSQPILLELEAPLK, z = 2, m/z = 977.07 Da, was detected by SEQUEST with high confidence. The bar represents the LC signal amplitude for this mass with tolerance 0.03 Da. C, multistep growth kinetics of EBOV-eGFP in Vero-E6 cells, which were treated with the indicated compounds 30 min prior to the infection with EBOV-eGFP at MOI 0.01 pfu/cell. Following 1-h-long adsorption, media were removed, and fresh media containing the original concentrations of the molecules were added. For the samples in which no virus was detected, the values 2-fold below the limit of detection were assigned. Shown are mean EBOV-eGFP titers ± S.E. in the medium, based on triplicate monolayers. D, induction of VP30 phosphorylation by 1E7-03. 293T cells expressing FLAG-tagged VP30 were treated with 0.1 μm okadaic acid (OA) or 10 μm 1E7-03 and labeled with [32P]orthophosphate. VP30 was immunoprecipitated, resolved on 10% SDS-PAGE, and either exposed to a PhosphorImager screen (top) or probed for VP30 with anti-FLAG antibodies (bottom). The ImageQuant software was used to quantify the PhosphorImager data, which were normalized by dividing phosphorylation values by protein values. The bars show averages of three independent experiments ± S.D. (error bars). The p values were calculated by Student's paired t test. E, induction of VP30 phosphorylation in Vero-E6 cells. Vero-E6 cells expressing FLAG-tagged VP30 were treated with 0.1 μm okadaic acid (OA) and labeled with [32P]orthophosphate. VP30 was immunoprecipitated, resolved on 10% SDS-PAGE, and either exposed to a PhosphorImager screen (top) or probed for VP30 with anti-FLAG antibodies (bottom). The bars show unadjusted PhosphorImager mean values ± S.D. The p value was calculated by Student's paired t test. F, comparison of 1E7-03-induced phosphorylation of VP30 in Vero-E6 and 293T cells; the experiment was performed similarly to that shown in E. WB, Western blot.
FIGURE 4.
FIGURE 4.
Viability of Vero-E6 and 293T cells treated with the indicated compounds at the indicated concentrations on days 1 and 3. The values represent mean percentages of cells with viability of untreated cells considered to be 100% based on triplicate monolayers ± S.D. (error bars). Note that the error bars for Vero-E6 cells are not seen due to their small size.
FIGURE 5.
FIGURE 5.
Effect of the small molecules on replication of EBOV-eGFP in Vero-E6 cells. A, cells on day 5 postinfection with EBOV-eGFP at MOI 0.001 pfu/cell: untreated (left) or treated with 1E7-03 (3 μm) 30 min prior to infection under UV (left, middle) or bright field (BF) microscopy (right). B, effect of the time of 1E7-03 addition on multistep growth kinetics of EBOV at MOI 0.01 pfu/ml. 1E7-03 was added at 10 μm 24 h prior to, during, or 24 or 48 h after infection. After 1-h-long adsorption, the medium was removed, cells were washed with phosphate-buffered saline, and fresh medium was added; in the case of treatment, 24 h prior to the infection or during the infection with 1E7-03, fresh medium contained 10 μm 1E7-03. C, concentration of 1E7-03 in water solution. Freshly dissolved 1E7-03 at a 1 μm concentration was aliquoted in 50-μl samples. Each sample was incubated at 37 °C for the indicated time and frozen until analyzed. The samples were analyzed by electrospray ionization-MS, and the amplitudes of peaks m/z = 504.2123 Da, z = 1 were recorded. D, effect of adding the 1E7-03 compound at 3 μm every 24 h starting at the indicated time. B and D, mean EBOV-eGFP titers ± S.E. (error bars) in the medium, based on triplicate monolayers. The dotted lines indicate the limit of detection. E, the 1E7-03 compound has no effect on replication of RSV. HEp-2 cells were infected with RSV at MOI 0.1 pfu/ml and treated with 1E7-03 at 3 μm daily, as described for EBOV (D). Medium aliquots were collected daily and flash-frozen; RSV was titrated in HEp-2 monolayers, and on day 2, plaques were immunostained using mouse monoclonal antibodies specific for the F protein of the virus and counted.
FIGURE 6.
FIGURE 6.
UV microscopy of Vero-E6 cells, which were infected with EBOV-eGFP at 0.01 pfu/cell and treated daily with 1E7-03 at 3 μm starting 24 h prior to the infection or during infection. Days 5 and 8 postinfection are shown. No eGFP-positive cells were observed in 1E7-03-treated monolayers on days 1–4, which are therefore not shown.
FIGURE 7.
FIGURE 7.
Effect of 1E7-03 on the transcription and replication of EBOV genome. A and B, analysis of transcription of the monocistronic (A) and bicistronic (B) minigenome by the luciferase assay: mean values based on triplicate samples ± S.E. (error bars). Shown is statistical significance of the 1E7-03-mediated reduction of the transcription (Student's unpaired t test), lane 3 versus lane 2 (A and B). A, p < 0.01; B, gene 1, p = 0.03; gene 2, p = 0.05. C, analysis of replication of the monocistronic minigenome by Northern blotting; the EBOV miniantigenome bands were quantified by a PhosphorImager. Please note that irrelevant lanes between lanes 6 and 7 were removed. The following values were obtained after background subtractions (lanes 1–7): 228, 1,439, 6,788, 33,881, 25,696, 23,621, and 52,504. The experiment was repeated with results essentially similar to those shown in the figure.
FIGURE 8.
FIGURE 8.
Role of Thr143 and Thr146 in EBOV transcription. A, mutations of Thr143 and Thr146 increase VP30 phosphorylation. FLAG-tagged VP30 (WT) and its mutated forms T143D,T146D, VP30 T143A,T146A, VP30 S29–46A, and VP30 S29–46A T143A,T146A were expressed in 293T cells followed by treatment of cells with 10 μm 1E7-03. The cells were metabolically labeled with [32P]orthophosphate. VP30 was immunoprecipitated with anti-FLAG antibodies, resolved on 10% SDS-PAGE, and either exposed to a PhosphorImager screen (top) or probed for VP30 with anti-FLAG antibodies (middle). The quantitative phosphorylation data were normalized to VP30 expression by dividing phosphorylation values by protein values; mean values ± S.D. (error bars) are indicated (bottom). The p values were calculated by Student's paired t test. B, mutations in VP30 Thr143 and Thr146 residues reduce EBOV transcription: transcription of the monocistronic minigenome in the presence of VP30 in which threonines in position 143 and/or 146 were substituted with aspartic acids to mimic permanent phosphorylation. Mean luciferase signals are based on six samples ± S.E. The p values were calculated by Student's paired t test; comparison with non-mutated VP30: *, p = 0.028, **, p = 0.006.
FIGURE 9.
FIGURE 9.
A model of the effects of 1E7-03 on EBOV. A, during the EBOV life cycle, VP30 exists in two modes: active (dephosphorylated), in which it promotes transcription of the viral genome by the viral polymerase complex, and inactive (phosphorylated), when the polymerase switches to the replication mode. The 1E7-03 compound prevents dephosphorylation of VP30 by PP1, thereby skewing the transcription/replication balance toward replication and reducing transcription, which restricts viral growth. The viral genome of the negative polarity is shown in black with the seven genes depicted as thick bars; the seven mRNAs are depicted in red, and the anti-genomes of the positive polarity are depicted in blue. B, comparison of the phosphorylation sites of VP30 of various species of filoviruses. The phosphorylated serine (S) residues of EBOV (7) and Marburg virus (48) and the putative phosphorylated residues of additional filovirus species are highlighted in red. Shown in the order of PubMed accession numbers are the VP30 N-terminal 60 amino acids of EBOV, Q05323; Sudan virus (SUDV), AY729654.1; Bundibugyo virus (BDBV), YP_003815438.1; Taï Forest virus (TAFV), FJ217162.1; Marburg virus (MARV), P35258; and Ravn virus (RAVV), DQ447649.1.

Similar articles

Cited by

References

    1. World Health Organization (1978) Ebola haemmorhagic fever in Zaire, 1976. Bull. World Health Organ. 56, 271–293 - PMC - PubMed
    1. Centers for Disease Control and Prevention (2014) Outbreak of Ebola in Guinea, Liberia, and Sierra Leone, Centers for Disease Control and Prevention, Atlanta
    1. Kuhn J. H. (2008) Filoviruses, 1st Ed., pp. 190–251, Springer, New York
    1. Weik M., Modrof J., Klenk H. D., Becker S., Mühlberger E. (2002) Ebola virus VP30-mediated transcription is regulated by RNA secondary structure formation. J. Virol. 76, 8532–8539 - PMC - PubMed
    1. Biedenkopf N., Hartlieb B., Hoenen T., Becker S. (2013) Phosphorylation of Ebola virus VP30 influences the composition of the viral nucleocapsid complex: impact on viral transcription and replication. J. Biol. Chem. 288, 11165–11174 - PMC - PubMed

Publication types

MeSH terms