

Evaluating auditory stream segregation of SAM tone sequences by subjective and objective psychoacoustical tasks, and brain activity
- PMID: 24936170
- PMCID: PMC4047832
- DOI: 10.3389/fnins.2014.00119
Evaluating auditory stream segregation of SAM tone sequences by subjective and objective psychoacoustical tasks, and brain activity
Abstract
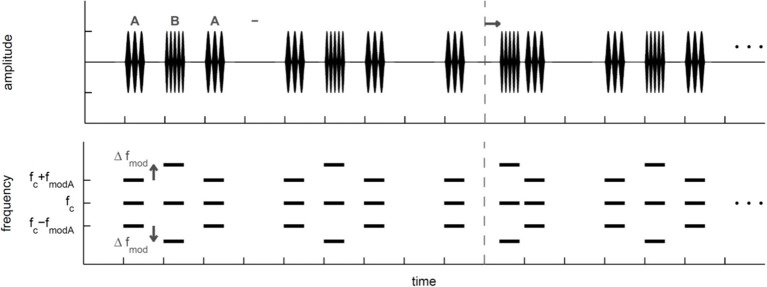
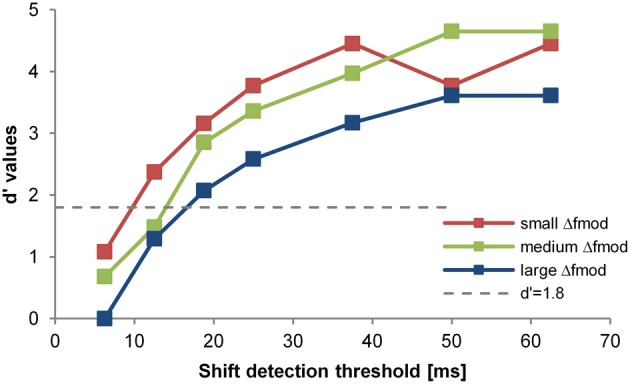
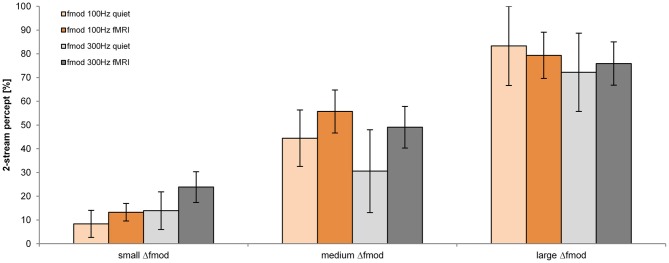
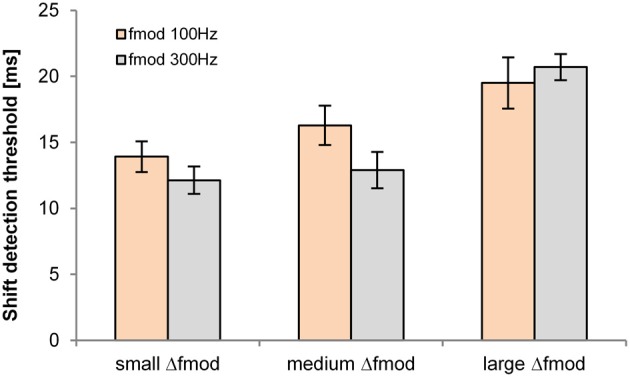
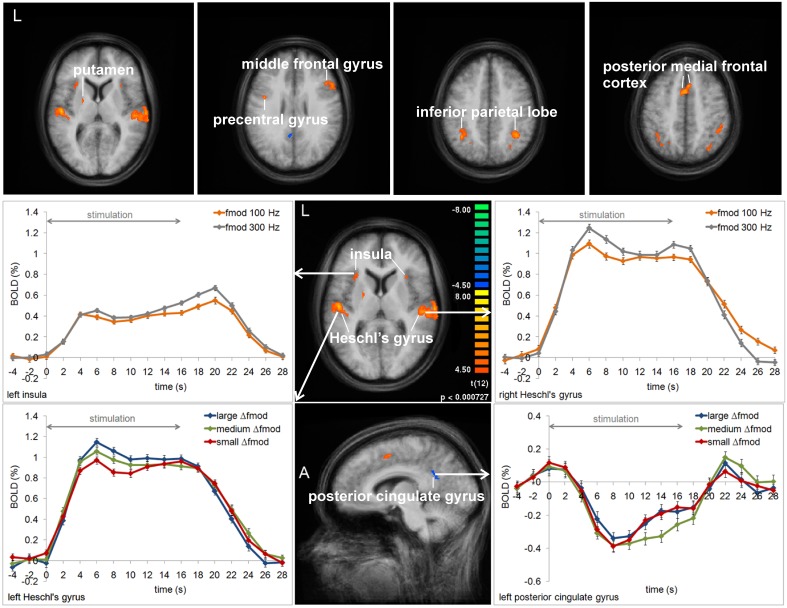
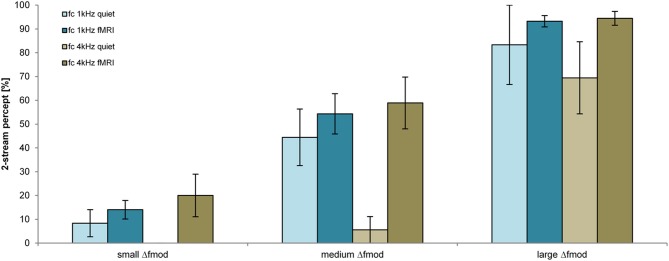
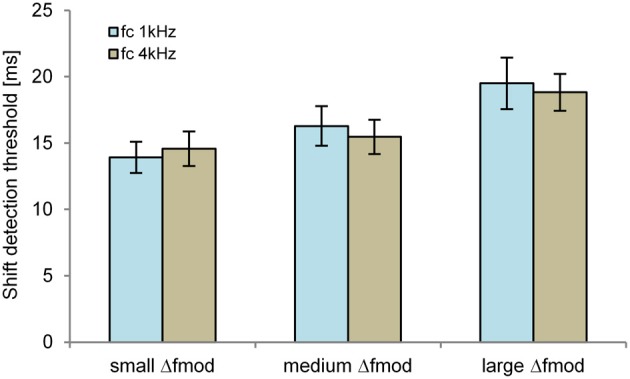
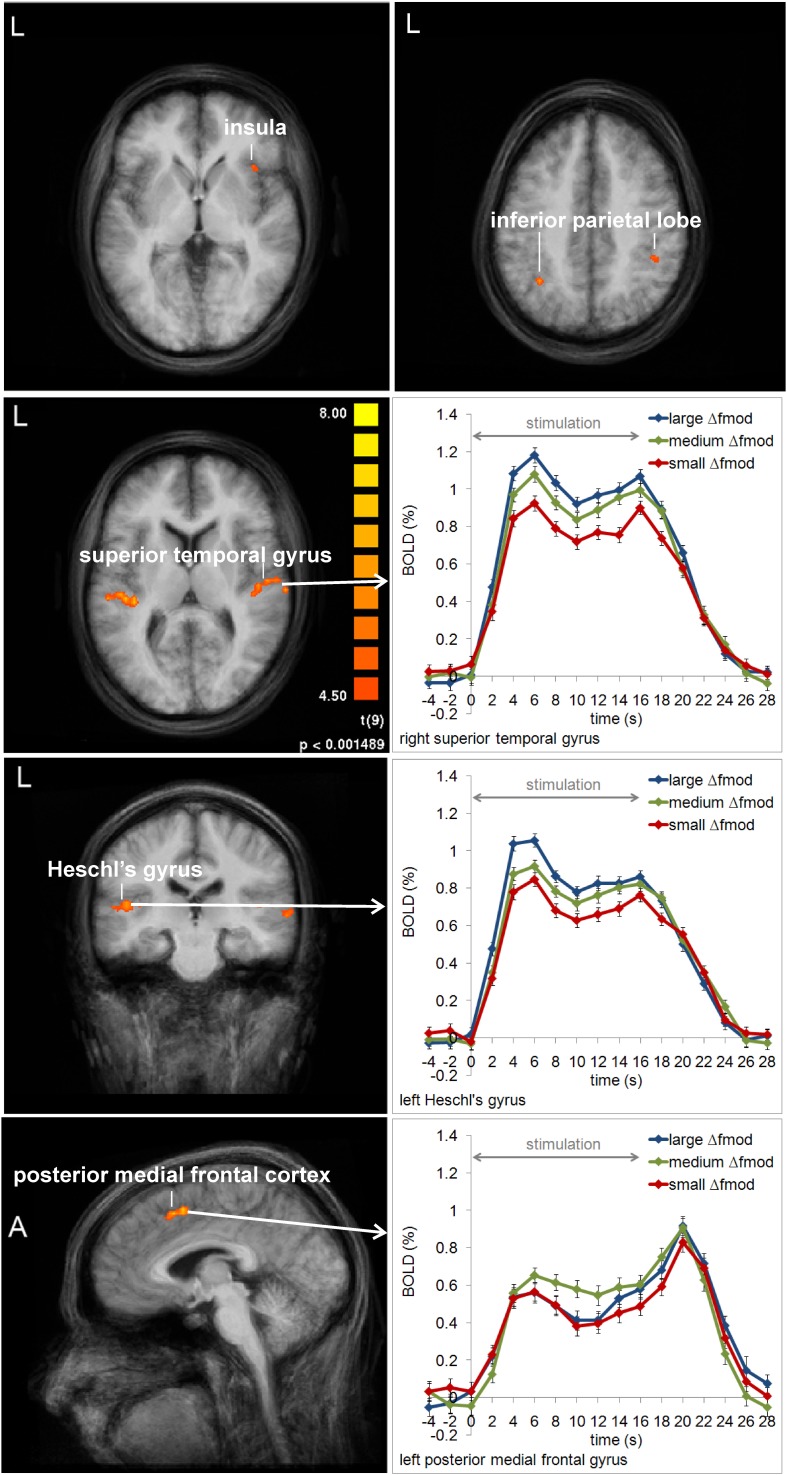
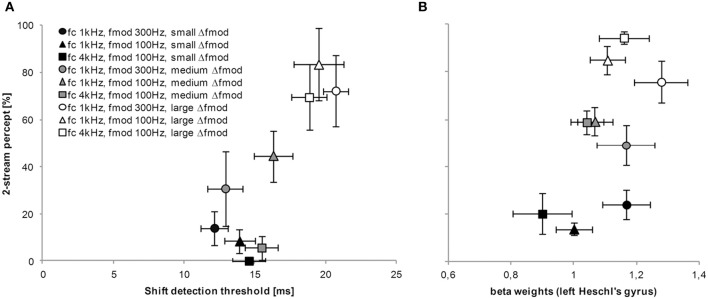
Auditory stream segregation refers to a segregated percept of signal streams with different acoustic features. Different approaches have been pursued in studies of stream segregation. In psychoacoustics, stream segregation has mostly been investigated with a subjective task asking the subjects to report their percept. Few studies have applied an objective task in which stream segregation is evaluated indirectly by determining thresholds for a percept that depends on whether auditory streams are segregated or not. Furthermore, both perceptual measures and physiological measures of brain activity have been employed but only little is known about their relation. How the results from different tasks and measures are related is evaluated in the present study using examples relying on the ABA- stimulation paradigm that apply the same stimuli. We presented A and B signals that were sinusoidally amplitude modulated (SAM) tones providing purely temporal, spectral or both types of cues to evaluate perceptual stream segregation and its physiological correlate. Which types of cues are most prominent was determined by the choice of carrier and modulation frequencies (f mod) of the signals. In the subjective task subjects reported their percept and in the objective task we measured their sensitivity for detecting time-shifts of B signals in an ABA- sequence. As a further measure of processes underlying stream segregation we employed functional magnetic resonance imaging (fMRI). SAM tone parameters were chosen to evoke an integrated (1-stream), a segregated (2-stream), or an ambiguous percept by adjusting the f mod difference between A and B tones (Δf mod). The results of both psychoacoustical tasks are significantly correlated. BOLD responses in fMRI depend on Δf mod between A and B SAM tones. The effect of Δf mod, however, differs between auditory cortex and frontal regions suggesting differences in representation related to the degree of perceptual ambiguity of the sequences.
Keywords: BOLD response; amplitude modulation; auditory scene analysis; fMRI; temporal and spectral cues; time shift detection.
Figures
Similar articles
-
Decision making and ambiguity in auditory stream segregation.Front Neurosci. 2015 Aug 11;9:266. doi: 10.3389/fnins.2015.00266. eCollection 2015. Front Neurosci. 2015. PMID: 26321899 Free PMC article.
-
Stream segregation in the perception of sinusoidally amplitude-modulated tones.PLoS One. 2012;7(9):e43615. doi: 10.1371/journal.pone.0043615. Epub 2012 Sep 12. PLoS One. 2012. PMID: 22984436 Free PMC article.
-
Neural correlates of auditory stream segregation in primary auditory cortex of the awake monkey.Hear Res. 2001 Jan;151(1-2):167-187. doi: 10.1016/s0378-5955(00)00224-0. Hear Res. 2001. PMID: 11124464
-
Primitive auditory stream segregation: a neurophysiological study in the songbird forebrain.J Neurophysiol. 2004 Aug;92(2):1088-104. doi: 10.1152/jn.00884.2003. Epub 2004 Mar 24. J Neurophysiol. 2004. PMID: 15044521
-
Auditory streaming of amplitude-modulated sounds in the songbird forebrain.J Neurophysiol. 2009 Jun;101(6):3212-25. doi: 10.1152/jn.91333.2008. Epub 2009 Apr 8. J Neurophysiol. 2009. PMID: 19357341
Cited by
-
The cognitive hearing science perspective on perceiving, understanding, and remembering language: The ELU model.Front Psychol. 2022 Sep 1;13:967260. doi: 10.3389/fpsyg.2022.967260. eCollection 2022. Front Psychol. 2022. PMID: 36118435 Free PMC article. Review.
-
Perceptual organization and stability of auditory streaming for pure tones and /ba/ stimuli.J Acoust Soc Am. 2020 Aug;148(2):EL159. doi: 10.1121/10.0001744. J Acoust Soc Am. 2020. PMID: 32873027 Free PMC article.
-
Decision making and ambiguity in auditory stream segregation.Front Neurosci. 2015 Aug 11;9:266. doi: 10.3389/fnins.2015.00266. eCollection 2015. Front Neurosci. 2015. PMID: 26321899 Free PMC article.
-
Automaticity and primacy of auditory streaming: Concurrent subjective and objective measures.J Exp Psychol Hum Percept Perform. 2016 Mar;42(3):339-353. doi: 10.1037/xhp0000146. Epub 2015 Sep 28. J Exp Psychol Hum Percept Perform. 2016. PMID: 26414168 Free PMC article.
-
Animal models for auditory streaming.Philos Trans R Soc Lond B Biol Sci. 2017 Feb 19;372(1714):20160112. doi: 10.1098/rstb.2016.0112. Epub 2017 Jan 2. Philos Trans R Soc Lond B Biol Sci. 2017. PMID: 28044022 Free PMC article. Review.
References
LinkOut - more resources
Full Text Sources
Other Literature Sources
Research Materials