

Comparison of salivary IgA secretion rate collected by the aspiration method and swab method
- PMID: 24936369
- PMCID: PMC4034363
- DOI: 10.12938/bmfh.32.107
Comparison of salivary IgA secretion rate collected by the aspiration method and swab method
Abstract
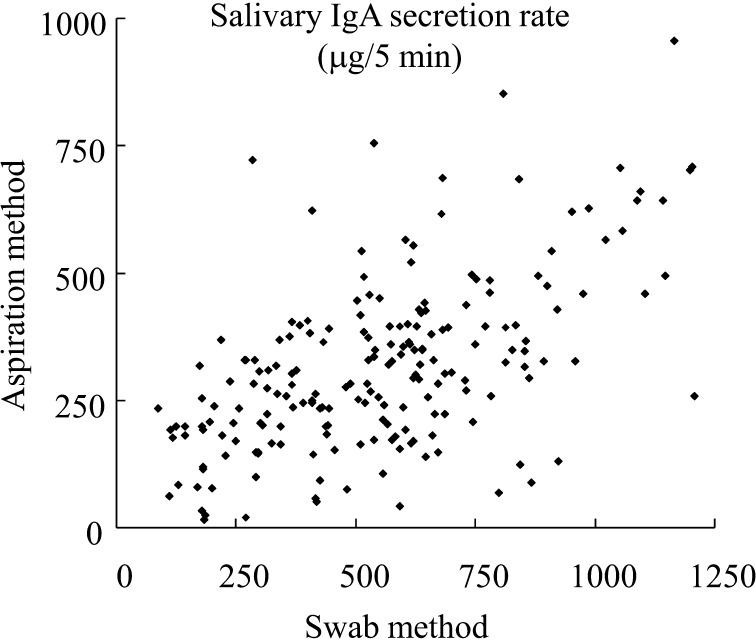
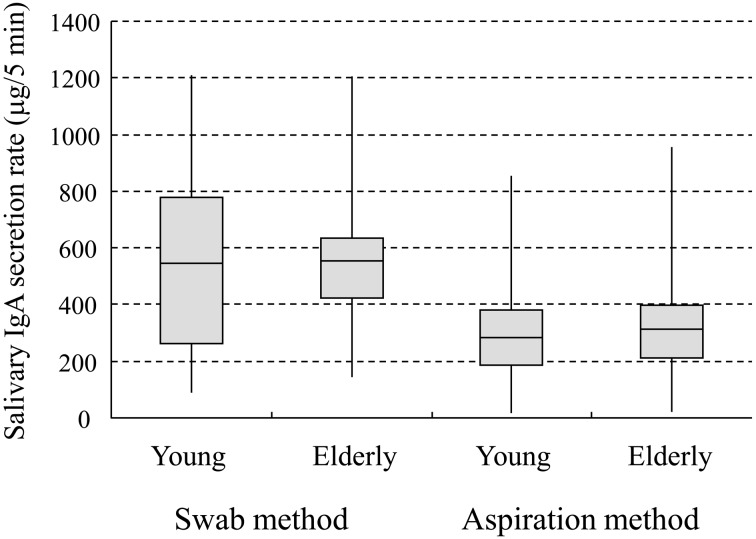
Salivary immunoglobulin A (IgA) is used as an immunity marker, as saliva can be easily collected, noninvasively with little stress. However, several saliva collection methods can be used. Our comparison between samples collected using different methods demonstrated that the salivary IgA secretion rate in samples collected using an aspiration method was significantly correlated with that in samples collected using a swab method. Moreover, the significant circadian variation in salivary IgA secretion rate in the aspirated saliva suggested that the aspiration method does not suppress salivary IgA secretion rate variability compared with the swab method. Therefore, the aspiration method should be considered as the preferable saliva collection method.
Keywords: IgA; Saliva collection; aspiration; swab.
Figures
References
-
- McKay DM, Perdue MH. 1993. Intestinal epithelial function: the case for immunophysiological regulation. Cells and mediators (1). Dig Dis Sci 38: 1377–1387 - PubMed
-
- Challacombe SJ, Percival RS, Marsh PD. 1995. Age-related changes in immunoglobulin isotypes in whole and parotid saliva and serum in healthy individuals. Oral Microbiol Immunol 10: 202–207 - PubMed
-
- Miletic ID, Schiffman SS, Miletic VD, Sattely-Miller EA. 1996. Salivary IgA secretion rate in young and elderly persons. Physiol Behav 60: 243–248 - PubMed
-
- Phillips AC, Carroll D, Evans P, Bosch JA, Clow A, Hucklebridge F, Der G. 2006. Stressful life events are associated with low secretion rates of immunoglobulin A in saliva in the middle aged and elderly. Brain Behav Immun 20: 191–197 - PubMed
-
- Gallagher S, Phillips AC, Evans P, Der G, Hunt K, Carroll D. 2008. Caregiving is associated with low secretion rates of immunoglobulin A in saliva. Brain Behav Immun 22: 565–572 - PubMed
LinkOut - more resources
Full Text Sources
Other Literature Sources
Miscellaneous