

Distinct neural signatures of cognitive subtypes of dyslexia with and without phonological deficits
- PMID: 24936406
- PMCID: PMC4054964
- DOI: 10.1016/j.nicl.2013.03.010
Distinct neural signatures of cognitive subtypes of dyslexia with and without phonological deficits
Abstract
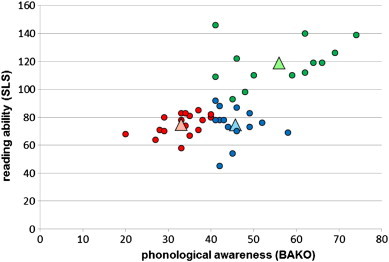
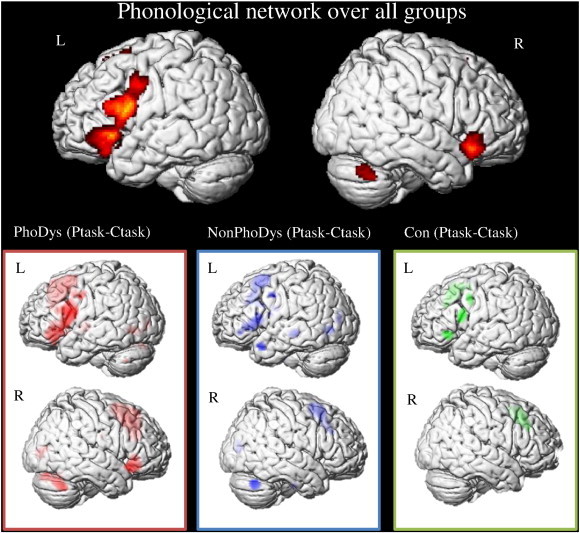
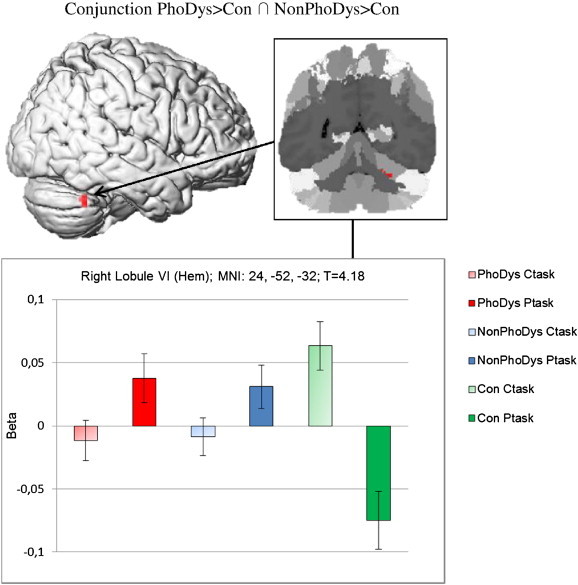
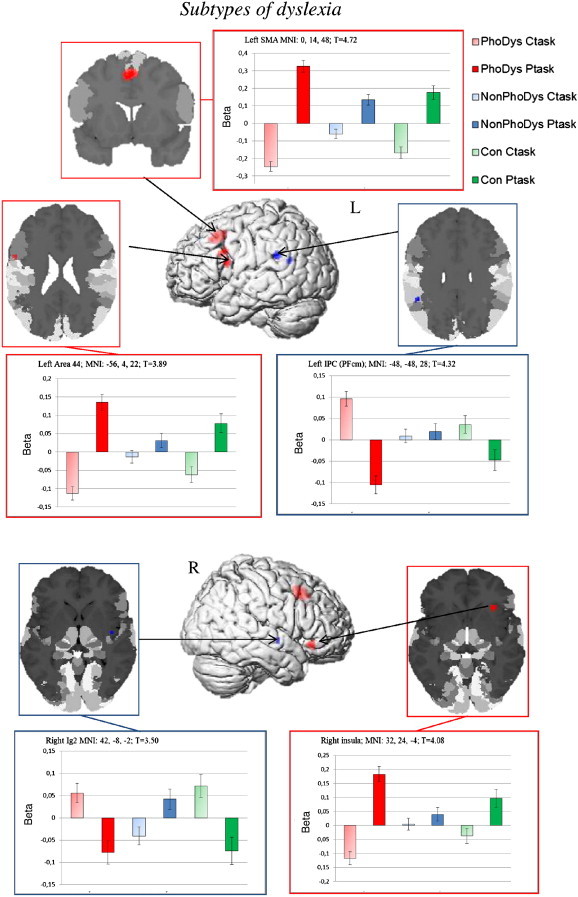
Developmental dyslexia can be distinguished as different cognitive subtypes with and without phonological deficits. However, despite some general agreement on the neurobiological basis of dyslexia, the neurofunctional mechanisms underlying these cognitive subtypes remain to be identified. The present BOLD fMRI study thus aimed at investigating by which distinct and/or shared neural activation patterns dyslexia subtypes are characterized. German dyslexic fourth graders with and without deficits in phonological awareness and age-matched normal readers performed a phonological decision task: does the auditory word contain the phoneme/a/? Both dyslexic subtypes showed increased activation in the right cerebellum (Lobule IV) compared to controls. Subtype-specific increased activation was systematically found for the phonological dyslexics as compared to those without this deficit and controls in the left inferior frontal gyrus (area 44: phonological segmentation), the left SMA (area 6), the left precentral gyrus (area 6) and the right insula. Non-phonological dyslexics revealed subtype-specific increased activation in the left supramarginal gyrus (area PFcm; phonological storage) and angular gyrus (area PGp). The study thus provides the first direct evidence for the neurobiological grounding of dyslexia subtypes. Moreover, the data contribute to a better understanding of the frequently encountered heterogeneous neuroimaging results in the field of dyslexia.
Keywords: Children; Cognitive subtypes; Dyslexia; Neuroimaging; Phonological deficit; Reading.
Figures
References
-
- Amunts K., Schleicher A., Bürgel U., Mohlberg H., Uylings H.B., Zilles K. Broca's region revisited: cytoarchitecture and intersubject variability. The Journal of Comparative Neurology. 1999;412(2):319–341. - PubMed
-
- Amunts K., Malikovic A., Mohlberg H., Schormann T., Zilles K. Brodmann's areas 17 and 18 brought into stereotaxic space—where and how variable? NeuroImage. 2000;11(1):66–84. - PubMed
-
- Amunts K., Weiss P.H., Mohlberg H., Pieperhoff P., Eickhoff S., Gurd J.M., Marshall J.C., Shah N.J., Fink G.R., Zilles K. Analysis of neural mechanisms underlying verbal fluency in cytoarchitectonically defined stereotaxic space—the roles of Brodmann areas 44 and 45. NeuroImage. 2004;22(1):42–56. - PubMed
-
- Bamiou D.-E., Musiek F.E., Luxon L.M. The insula (Island of Reil) and its role in auditory processing. Literature review. Brain Research. Brain Research Reviews. 2003;42(2):143–154. - PubMed
-
- Bosse M.-L., Tainturier M.J., Valdois S. Developmental dyslexia: the visual attention span deficit hypothesis. Cognition. 2007;104(2):198–230. - PubMed
LinkOut - more resources
Full Text Sources
Other Literature Sources
Miscellaneous
