. 2014 May 15;2(6):866-80.
doi: 10.1016/j.stemcr.2014.03.014. eCollection 2014 Jun 3.

Genetic and chemical correction of cholesterol accumulation and impaired autophagy in hepatic and neural cells derived from Niemann-Pick Type C patient-specific iPS cells

Affiliations

Genetic and chemical correction of cholesterol accumulation and impaired autophagy in hepatic and neural cells derived from Niemann-Pick Type C patient-specific iPS cells

Dorothea Maetzel et al. Stem Cell Reports. .

Abstract

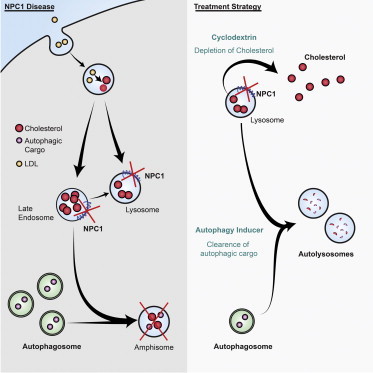
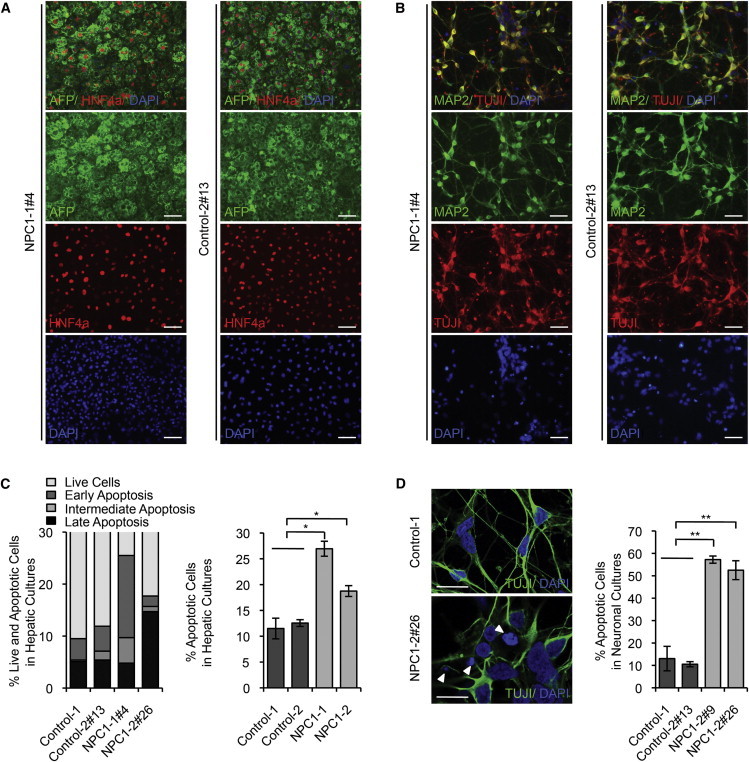
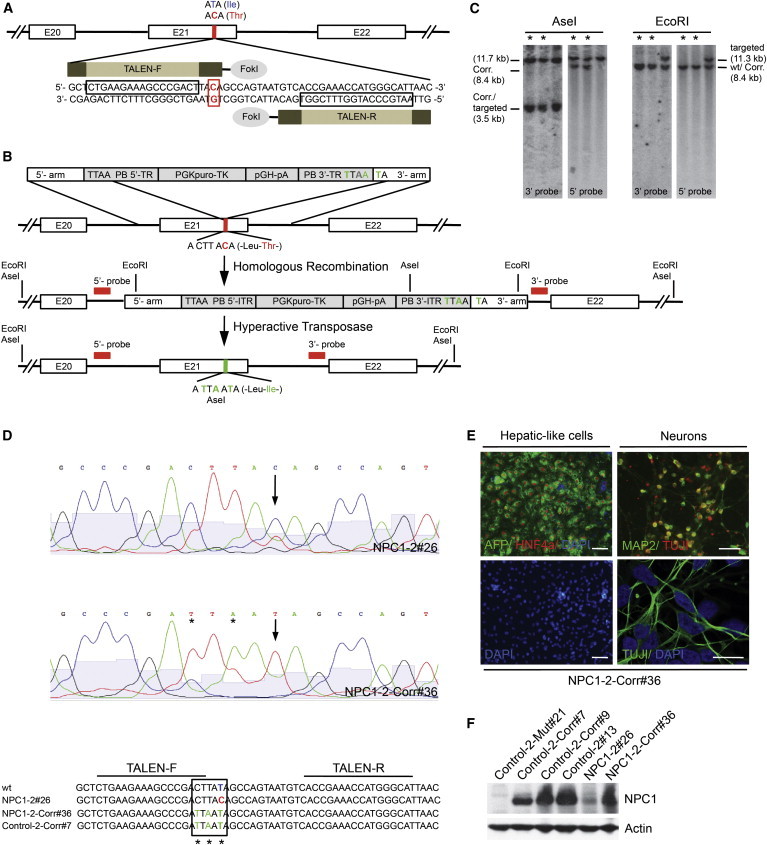
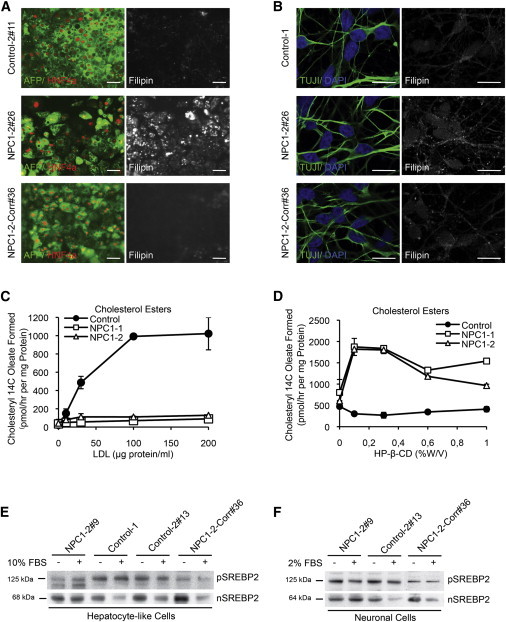
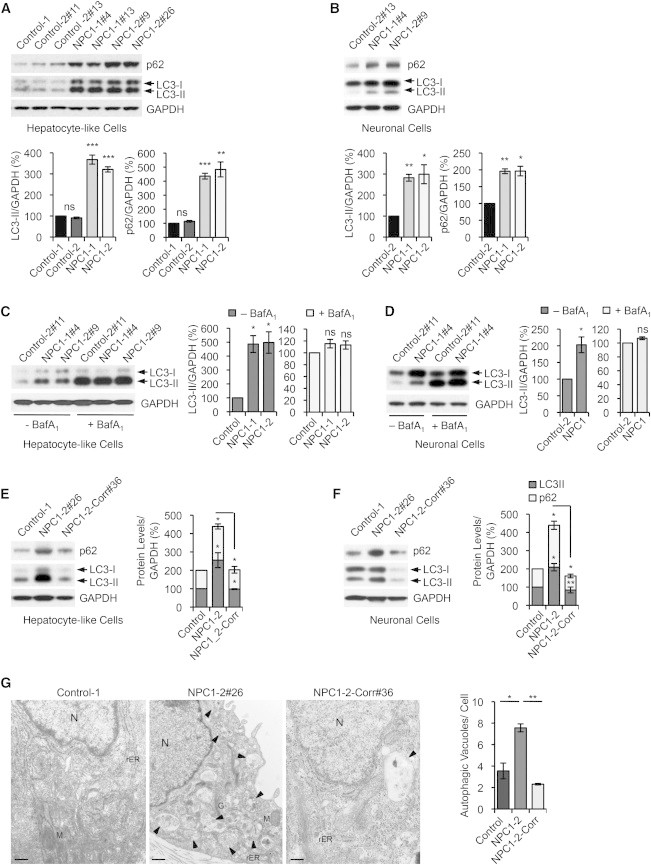
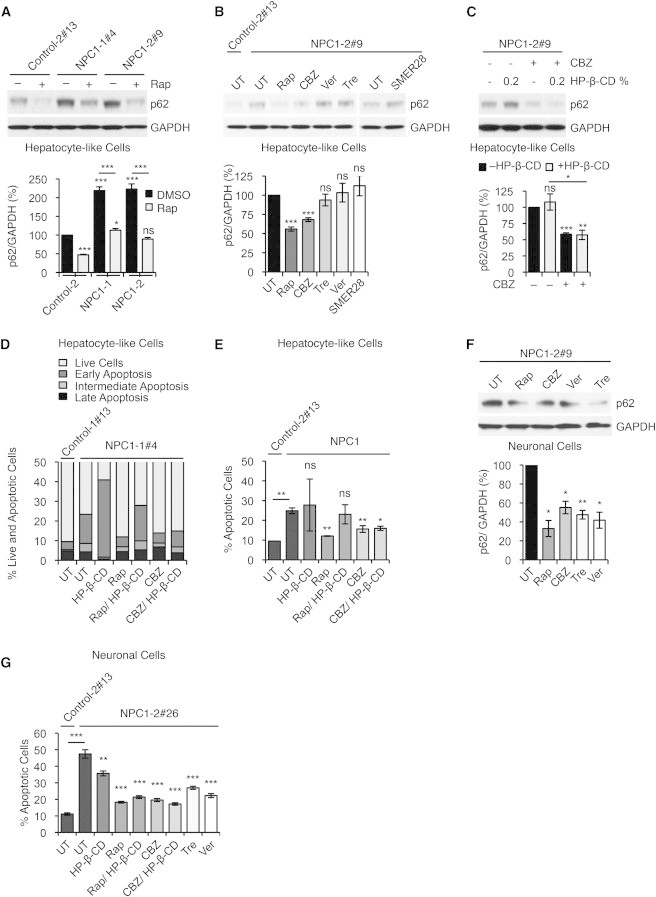
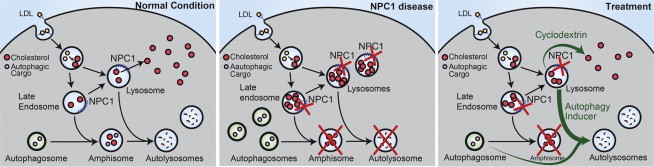
Niemann-Pick type C (NPC) disease is a fatal inherited lipid storage disorder causing severe neurodegeneration and liver dysfunction with only limited treatment options for patients. Loss of NPC1 function causes defects in cholesterol metabolism and has recently been implicated in deregulation of autophagy. Here, we report the generation of isogenic pairs of NPC patient-specific induced pluripotent stem cells (iPSCs) using transcription activator-like effector nucleases (TALENs). We observed decreased cell viability, cholesterol accumulation, and dysfunctional autophagic flux in NPC1-deficient human hepatic and neural cells. Genetic correction of a disease-causing mutation rescued these defects and directly linked NPC1 protein function to impaired cholesterol metabolism and autophagy. Screening for autophagy-inducing compounds in disease-affected human cells showed cell type specificity. Carbamazepine was found to be cytoprotective and effective in restoring the autophagy defects in both NPC1-deficient hepatic and neuronal cells and therefore may be a promising treatment option with overall benefit for NPC disease.


Figures

None
Graphical abstract
Figure 1
Figure 1
Generation and Characterization of Patient-Specific NPC1 iPSCs (A) Immunofluorescence staining of hepatic cultures derived from representative NPC1 iPSC lines 21 days after induction of hepatocyte differentiation for Alpha-fetoprotein (AFP; green) and HNF4a (red). Nuclei were stained with DAPI (blue). Scale bar, 100 μm. (B) Immunofluorescence staining of neuronal cultures derived from representative NPC1 iPSC lines 14 days after induction of differentiation for neuron-specific microtubule-associated protein 2 (MAP2; green) and class III β-tubulin (TUJI; red). Nuclei were stained with DAPI (blue). Scale bar, 100 μm. (C) FACS analysis of cell viability and apoptosis in control and NPC1 iPSC-derived hepatic cultures measuring FITC-Annexin V and propidium iodide staining. Graphical data (right panel) represent mean ± SE (n = 3). (D) Analysis of cell death in control and NPC1 iPSC-derived 5-week-old TUJI positive neurons. Nuclei stained with DAPI. Arrow shows apoptotic nuclei. Scale bar, 10 μm. Graphical data represent mean ± SE (n = 3). Results shown are representative of at least three independent experiments using two different clones of each line unless otherwise indicated. ∗∗∗p < 0.001; ∗∗p < 0.01; p < 0.05; ns, nonsignificant.
Figure 2
Figure 2
Correction of NPC1I1061T Mutation in Patient-Specific iPSCs (A) Schematic overview of specific TALENs cutting site in the NPC1 gene. Blue letters are indicating the wild-type base and amino acid, respectively; red indicates the mutation. (B) Schematic overview depicting the NPC1I1061T targeting strategy showing piggyBac (PB) donor plasmid design with homologous 5′- and 3′-arms, PB terminal repeats (PB-TR), and selection cassette (PGK-puroTK, pGH-pA). Exons (white boxes), restriction sites, and location of external 5′ and 3′ Southern blot probes (red bars) are indicted. Enlarged sequence indicates I1061T mutation in exon 21 (red base). Introduced changes are labeled in green. (C) Southern blot analysis of NPC1 iPSCs after excision of PB selection cassette. Fragment sizes of wild-type (wt), corrected (Corr.), and targeted alleles are indicated. Excised clones are marked with an asterisk. (D) Sequencing of genomic NPC1 locus in indicated NPC1 iPSC lines. The corrected I1061T mutation is marked with an arrow, induced bp changes with an asterisk. (E) Immunofluorescence staining of hepatic [AFP (green) and HNF4a (red)] and neuronal cultures [MAP2 (green) and TUJ1 (red or green, respectively)] derived from representative NPC1-2-Corr#36 line. Nuclei were stained with DAPI (blue). Scale bar, 100 μm and 10 μm (lower right). (F) Immunoblot analysis of indicated control and NPC1 iPSCs lines detecting NPC1 and actin protein levels. Results shown in (C)–(F) are representative of at least three independent experiments using two different clones of each line.
Figure 3
Figure 3
Analysis of Cholesterol Metabolism in Isogenic NPC1 iPSC-Derived Cell Types (A and B) Immunofluorescence staining of representative control, mutant, and corrected NPC1 iPSC-derived hepatic (A) and neuronal (B) cells with lineage markers [AFP, green; HNF4a, red (A); TUJI, green (B)], respectively. Endogenous cholesterol was detected by Filipin staining (white) in the same samples as the lineage marker staining (A) or in duplicate samples of the same experiment (B). Scale bar, (A) 100 μm and (B) 10 μm. Results shown are representative of at least three independent experiments using two different clones of each line. (C) Cholesterol ester formation in NPC1-deficient and control hepatic-like cultures after exposure to different concentrations of low-density lipoprotein (LDL). Mean variation for each of the duplicate incubations for control, NPC1-1, and NPC1-2 were in a range between 9% and 20% for the untreated samples and between 1%–31% for the data points at the different LDL concentrations, respectively. (D) Cholesterol ester formation in NPC1 iPSC-derived hepatic cultures after exposure to different concentrations of HP-β-cyclodextrin (HP-β-CD [%w/v]). Mean variations for each of the duplicate incubations for control, NPC1-1, and NPC1-2 were in a range between 1% and 37% for the untreated samples and between 0.2% and 24% for the data points at the different HP-β-CD concentrations, respectively. (C and D) Results shown are the mean of duplicates of each cell line and representative for three independent experiments using different clones of indicated cell lines. (E and F) Immunoblot analysis detecting the activation of sterol regulatory element-binding protein 2 (SREBP2) cleavage in NPC1 iPSC-derived hepatic (E) and neuronal (F) cells after incubation with indicated serum concentrations. pSREBP2 (precursor SREBP2) in the cytoplasmic and nSREBP2 in the nuclear fraction of cell lysates were detected. Protein sizes are indicated. Results shown are representative of at least three independent experiments using two different clones of each line.
Figure 4
Figure 4
Genetic Correction of Autophagy Phenotype in NPC1 iPSC-Derived cells (A and B) Immunoblot analysis and quantifications of p62 and LC3-II levels using anti-p62, anti-LC3, and anti-GAPDH antibodies in hepatic (A) and neuronal cultures (B) derived from indicated control and NPC1 iPSC lines. Graphical data represent mean ± SE (n = 4). (C and D) Immunoblot analysis and quantification of LC3-II levels using anti-LC3 and anti-GAPDH antibodies in hepatic (C) and neuronal cultures (D) derived from control and NPC1 iPSC lines, treated with or without 400 nM bafilomycin A1 (BafA1) for 4 hr. Graphical data represent mean ± SE (n = 3). (E and F) Immunoblot analysis and quantifications of p62 and LC3-II levels in hepatic (E) and neuronal cultures (F) derived from the NPC1-2 iPSC line after correction of the NPC1I1061T mutation. Graphical data represent mean ± SE (n = 3). (G) Electron microscopy images of representative NPC1 iPSC-derived hepatic-like cells before and after genome editing. Arrows are indicating autophagic vacuoles. Graphical data represent mean ± SE (n = 3). Nucleus (N), rough endoplasmatic reticulum (rER), mitochondria (M), Golgi (G). Scale bar, 500 nm. Results shown are representative for at least three independent experiments using two different clones of each line. ∗∗∗p < 0.001; ∗∗p < 0.01; p < 0.05; ns, nonsignificant.
Figure 5
Figure 5
Chemical Correction of Autophagy Phenotype in NPC1 iPSC-Derived cells (A) Immunoblot analysis and quantification of p62 levels using anti-p62 and anti-GAPDH antibodies in control and NPC1 iPSC-derived hepatic cultures, treated with either DMSO (vehicle control) or rapamycin (Rap). Graphical data represent mean ± SE (n = 3). (B) Immunoblot analysis and quantification of p62 levels using anti-p62 and anti-GAPDH antibodies in control and NPC1 iPSC-derived hepatic cultures after treatment with autophagy inducing compounds: untreated (UT), rapamycin (Rap), carbamazepine (CBZ), verapamil (Ver), trehelose (Tre), and SMER28. Graphical data represent mean ± SE (n = 3). (C) Immunoblot analysis and quantification of p62 levels using anti-p62 and anti-GAPDH antibodies in NPC1 iPSC-derived hepatic cultures, treated with CBZ and HP-β-CD as indicated. Graphical data represent mean ± SE (n = 3). (D and E) FACS analysis of cell viability and apoptosis in NPC1 iPSC-derived hepatic cultures after treatment with indicated compounds measuring FITC-Annexin V and propidium iodide staining. (E) Graphical data represent mean ± SE (n = 3). (F) Immunoblot analysis and quantification of p62 levels using anti-p62 and anti-GAPDH antibodies in NPC1 iPSC-derived neuronal cultures after treatment with autophagy inducing compounds: untreated (UT), Rap, CBZ, Ver, and Tre. Graphical data represent mean ± SE (n = 3). (G) Analysis of cell death in NPC1 iPSC-derived 5-week-old neurons by assessing fragmented and TUNNEL positive nuclei. Graphical data represent mean ± SE (n = 6). Results shown are representative for at least two independent experiments using two different clones of each line. ∗∗∗p < 0.001; ∗∗p < 0.01; p < 0.05; ns, nonsignificant.
Figure 6
Figure 6
Schematic Overview of Correction of Functional Defects in NPC Disease-Affected Cell Types Left panel shows cholesterol distribution and autophagic flux under normal conditions. Middle panel shows the effects due to loss of NPC1 protein function on cholesterol metabolism and autophagic flux. Mutations in the NPC1 gene on both alleles lead to accumulation of cholesterol in the LE/L compartments by inhibiting its efflux, and to a block in autophagic flux causing accumulation of autophagosomes and autophagy substrate arising due to impaired formation of amphisomes. Chemical correction of disease related phenotypes are achieved by HP-β-cyclodextrin-mediated cholesterol release and CBZ-mediated autophagy induction (green arrows, right panel). Restoration of autophagic flux by autophagy inducer is possibly through a bypass mechanism.

Similar articles

Cited by

References

    1. Abi-Mosleh L., Infante R.E., Radhakrishnan A., Goldstein J.L., Brown M.S. Cyclodextrin overcomes deficient lysosome-to-endoplasmic reticulum transport of cholesterol in Niemann-Pick type C cells. Proc. Natl. Acad. Sci. USA. 2009;106:19316–19321. - PMC - PubMed
    1. Bjørkøy G., Lamark T., Pankiv S., Øvervatn A., Brech A., Johansen T. Monitoring autophagic degradation of p62/SQSTM1. Methods Enzymol. 2009;452:181–197. - PubMed
    1. Brown M.S., Goldstein J.L. The SREBP pathway: regulation of cholesterol metabolism by proteolysis of a membrane-bound transcription factor. Cell. 1997;89:331–340. - PubMed
    1. Carstea E.D., Morris J.A., Coleman K.G., Loftus S.K., Zhang D., Cummings C., Gu J., Rosenfeld M.A., Pavan W.J., Krizman D.B. Niemann-Pick C1 disease gene: homology to mediators of cholesterol homeostasis. Science. 1997;277:228–231. - PubMed
    1. Cermak T., Doyle E.L., Christian M., Wang L., Zhang Y., Schmidt C., Baller J.A., Somia N.V., Bogdanove A.J., Voytas D.F. Efficient design and assembly of custom TALEN and other TAL effector-based constructs for DNA targeting. Nucleic Acids Res. 2011;39:e82. - PMC - PubMed

Publication types