

The use of mixed generalized additive modeling to assess the effect of temperature on the usage of emergency electrocardiography examination among the elderly in Shanghai
- PMID: 24936868
- PMCID: PMC4061122
- DOI: 10.1371/journal.pone.0100284
The use of mixed generalized additive modeling to assess the effect of temperature on the usage of emergency electrocardiography examination among the elderly in Shanghai
Abstract
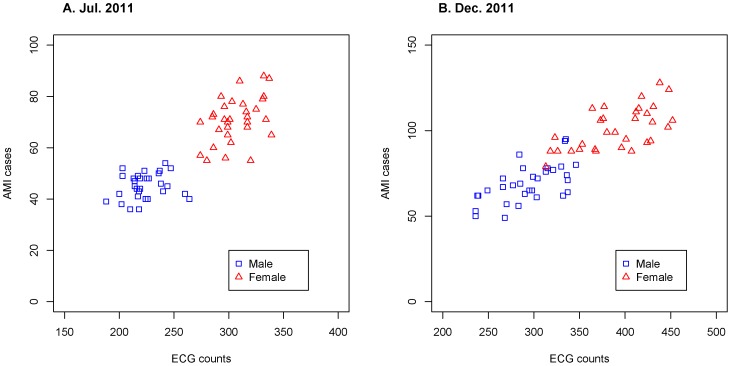
Background: Acute coronary artery diseases have been observed to be associated with some meteorological variables. But few of the previous studies considered autocorrelated outcomes. Electrocardiography is a widely used tool in the initial diagnosis of acute cardiovascular events, and emergency electrocardiography counts were shown to be highly correlated with acute myocardial infarction in our pilot study, hence a good index of prediction for acute cardiovascular events morbidity among the elderly. To indirectly assess the impact of temperature on the number of acute cardiovascular events, we studied the association between temperature and emergency electrocardiography counts while considering autocorrelated nature of the response variables.
Methods: We collected daily emergency electrocardiography counts for elderly females and males in Shanghai from 2007 to middle 2012, and studied temperature and other effects on these data using Mixed Generalized Additive Modelling methods. Delayed temperature effect distribution was described as the weighted average of the temperatures within 3 days before the counts was recorded. Autoregressive random effects were used in the model to describe the autocorrelation of the response variables.
Main results: Temperature effect was observed to be piecewise linearly associated with the logarithm of emergency electrocardiography counts. The optimal weights of the delayed temperature effect distribution were obtained from the model estimation. The weights of lag-1 were the maximums, significantly greater than the weights of lag-2 and lag-3 for both females and males. The model showed good fit with R2 values of 0.860 for females and 0.856 for males.
Conclusion: From the mixed generalized additive model, we infer that during cold and mild days, the number of emergency electrocardiography counts increase as temperature effect decreases, while during hot days, counts increase as temperature effect increases. Similar properties could be inferred for the occurrence of cardiovascular events.
Conflict of interest statement
Figures


Similar articles
-
Importance of applying Mixed Generalized Additive Model (MGAM) as a method for assessing the environmental health impacts: Ambient temperature and Acute Myocardial Infarction (AMI), among elderly in Shanghai, China.PLoS One. 2021 Aug 12;16(8):e0255767. doi: 10.1371/journal.pone.0255767. eCollection 2021. PLoS One. 2021. PMID: 34383808 Free PMC article.
-
Time series analysis of the association between ambient temperature and cerebrovascular morbidity in the elderly in Shanghai, China.Sci Rep. 2016 Jan 11;6:19052. doi: 10.1038/srep19052. Sci Rep. 2016. PMID: 26750421 Free PMC article.
-
Part 2. Association of daily mortality with ambient air pollution, and effect modification by extremely high temperature in Wuhan, China.Res Rep Health Eff Inst. 2010 Nov;(154):91-217. Res Rep Health Eff Inst. 2010. PMID: 21446212
-
Applied mixed generalized additive model to assess the effect of temperature on the incidence of bacillary dysentery and its forecast.PLoS One. 2013 Apr 29;8(4):e62122. doi: 10.1371/journal.pone.0062122. Print 2013. PLoS One. 2013. PMID: 23637978 Free PMC article.
-
Prognosis of unrecognised myocardial infarction determined by electrocardiography or cardiac magnetic resonance imaging: systematic review and meta-analysis.BMJ. 2020 May 7;369:m1184. doi: 10.1136/bmj.m1184. BMJ. 2020. PMID: 32381490 Free PMC article.
Cited by
-
Large-scale societal dynamics are reflected in human mood and brain.Sci Rep. 2022 Mar 17;12(1):4646. doi: 10.1038/s41598-022-08569-3. Sci Rep. 2022. PMID: 35301376 Free PMC article.
-
Importance of applying Mixed Generalized Additive Model (MGAM) as a method for assessing the environmental health impacts: Ambient temperature and Acute Myocardial Infarction (AMI), among elderly in Shanghai, China.PLoS One. 2021 Aug 12;16(8):e0255767. doi: 10.1371/journal.pone.0255767. eCollection 2021. PLoS One. 2021. PMID: 34383808 Free PMC article.
-
Association of sudden sensorineural hearing loss with meteorological factors: a time series study in Hefei, China, and a literature review.Environ Sci Pollut Res Int. 2024 Jun;31(30):42970-42990. doi: 10.1007/s11356-024-33943-1. Epub 2024 Jun 17. Environ Sci Pollut Res Int. 2024. PMID: 38886269 Free PMC article. Review.
-
Time series analysis of the association between ambient temperature and cerebrovascular morbidity in the elderly in Shanghai, China.Sci Rep. 2016 Jan 11;6:19052. doi: 10.1038/srep19052. Sci Rep. 2016. PMID: 26750421 Free PMC article.
-
Spatiotemporal high-resolution prediction and mapping: methodology and application to dengue disease.J Geogr Syst. 2022;24(4):527-581. doi: 10.1007/s10109-021-00368-0. Epub 2022 Feb 19. J Geogr Syst. 2022. PMID: 35221792 Free PMC article.
References
-
- Pell JP, Cobbe SM (1999) Seasonal variations in coronary heart disease. Q J Med 92: 689–696. - PubMed
-
- Lorenzo FD, Sharma V, Scully M, Kakkar VV (1999) Cold adaptation and the seasonal distribution of acute myocardial infarction. Q J Med 92: 747–751. - PubMed
-
- Collins KJ (1986) Low indoor temperatures and morbidity in the elderly. Age Ageing 15: 212–220. - PubMed
-
- Danet S, Richard F, Montaye M, Beauchant S, Lemaire B, et al. (1999) Unhealthy effects of atmospheric temperature and pressure on the occurrence of myocardial infarction and coronary deaths. A 10-year survey: the Lille-World Health Organization MONICA project (Monitoring trends and determinants in cardiovascular disease). Circulation 100: E1–7. - PubMed
Publication types
MeSH terms
LinkOut - more resources
Full Text Sources
Other Literature Sources
