

OccuPeak: ChIP-Seq peak calling based on internal background modelling
- PMID: 24936875
- PMCID: PMC4061025
- DOI: 10.1371/journal.pone.0099844
OccuPeak: ChIP-Seq peak calling based on internal background modelling
Abstract
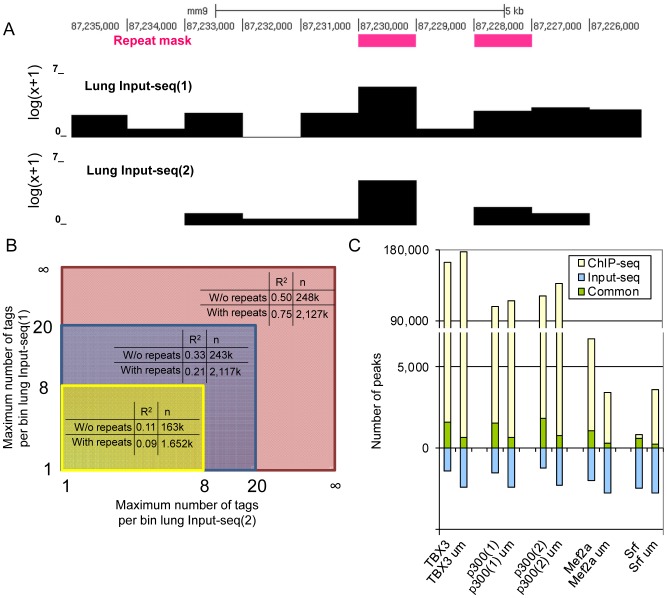
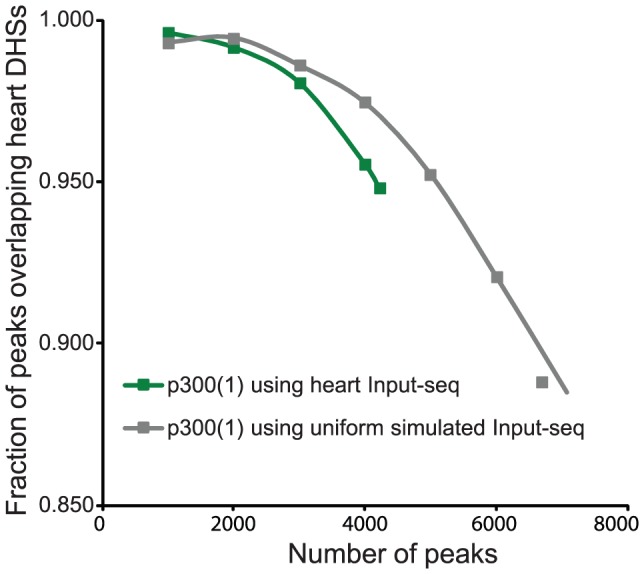
ChIP-seq has become a major tool for the genome-wide identification of transcription factor binding or histone modification sites. Most peak-calling algorithms require input control datasets to model the occurrence of background reads to account for local sequencing and GC bias. However, the GC-content of reads in Input-seq datasets deviates significantly from that in ChIP-seq datasets. Moreover, we observed that a commonly used peak calling program performed equally well when the use of a simulated uniform background set was compared to an Input-seq dataset. This contradicts the assumption that input control datasets are necessary to fatefully reflect the background read distribution. Because the GC-content of the abundant single reads in ChIP-seq datasets is similar to those of randomly sampled regions we designed a peak-calling algorithm with a background model based on overlapping single reads. The application, OccuPeak, uses the abundant low frequency tags present in each ChIP-seq dataset to model the background, thereby avoiding the need for additional datasets. Analysis of the performance of OccuPeak showed robust model parameters. Its measure of peak significance, the excess ratio, is only dependent on the tag density of a peak and the global noise levels. Compared to the commonly used peak-calling applications MACS and CisGenome, OccuPeak had the highest sensitivity in an enhancer identification benchmark test, and performed similar in an overlap tests of transcription factor occupation with DNase I hypersensitive sites and H3K27ac sites. Moreover, peaks called by OccuPeak were significantly enriched with cardiac disease-associated SNPs. OccuPeak runs as a standalone application and does not require extensive tweaking of parameters, making its use straightforward and user friendly.
Availability: http://occupeak.hfrc.nl.
Conflict of interest statement
Figures


Similar articles
-
RECAP reveals the true statistical significance of ChIP-seq peak calls.Bioinformatics. 2019 Oct 1;35(19):3592-3598. doi: 10.1093/bioinformatics/btz150. Bioinformatics. 2019. PMID: 30824903 Free PMC article.
-
WACS: improving ChIP-seq peak calling by optimally weighting controls.BMC Bioinformatics. 2021 Feb 15;22(1):69. doi: 10.1186/s12859-020-03927-2. BMC Bioinformatics. 2021. PMID: 33588754 Free PMC article.
-
Is this the right normalization? A diagnostic tool for ChIP-seq normalization.BMC Bioinformatics. 2015 May 9;16:150. doi: 10.1186/s12859-015-0579-z. BMC Bioinformatics. 2015. PMID: 25957089 Free PMC article.
-
Accounting for GC-content bias reduces systematic errors and batch effects in ChIP-seq data.Genome Res. 2017 Nov;27(11):1930-1938. doi: 10.1101/gr.220673.117. Epub 2017 Oct 12. Genome Res. 2017. PMID: 29025895 Free PMC article.
-
Role of ChIP-seq in the discovery of transcription factor binding sites, differential gene regulation mechanism, epigenetic marks and beyond.Cell Cycle. 2014;13(18):2847-52. doi: 10.4161/15384101.2014.949201. Cell Cycle. 2014. PMID: 25486472 Free PMC article. Review.
Cited by
-
Analysis of super-enhancer using machine learning and its application to medical biology.Brief Bioinform. 2023 May 19;24(3):bbad107. doi: 10.1093/bib/bbad107. Brief Bioinform. 2023. PMID: 36960780 Free PMC article. Review.
-
EMERGE: a flexible modelling framework to predict genomic regulatory elements from genomic signatures.Nucleic Acids Res. 2016 Mar 18;44(5):e42. doi: 10.1093/nar/gkv1144. Epub 2015 Nov 3. Nucleic Acids Res. 2016. PMID: 26531828 Free PMC article.
-
Chromatin Conformation Links Putative Enhancers in Intracranial Aneurysm-Associated Regions to Potential Candidate Genes.J Am Heart Assoc. 2019 May 7;8(9):e011201. doi: 10.1161/JAHA.118.011201. J Am Heart Assoc. 2019. PMID: 30994044 Free PMC article.
-
Genome-wide histone modification profiling of inner cell mass and trophectoderm of bovine blastocysts by RAT-ChIP.PLoS One. 2019 Nov 25;14(11):e0225801. doi: 10.1371/journal.pone.0225801. eCollection 2019. PLoS One. 2019. PMID: 31765427 Free PMC article.
-
Spatiotemporal regulation of enhancers during cardiogenesis.Cell Mol Life Sci. 2017 Jan;74(2):257-265. doi: 10.1007/s00018-016-2322-y. Epub 2016 Aug 6. Cell Mol Life Sci. 2017. PMID: 27497925 Free PMC article. Review.
References
-
- Barski A, Cuddapah S, Cui K, Roh TY, Schones DE, et al. (2007) High-resolution profiling of histone methylations in the human genome. Cell 129: 823–837. - PubMed
-
- Robertson G, Hirst M, Bainbridge M, Bilenky M, Zhao Y, et al. (2007) Genome-wide profiles of STAT1 DNA association using chromatin immunoprecipitation and massively parallel sequencing. Nat Methods 4: 651–657. - PubMed
-
- Johnson DS, Mortazavi A, Myers RM, Wold B (2007) Genome-wide mapping of in vivo protein-DNA interactions. Science 316: 1497–1502. - PubMed
-
- Hard T, Lundback T (1996) Thermodynamics of sequence-specific protein-DNA interactions. Biophys Chem 62: 121–139. - PubMed
Publication types
MeSH terms
LinkOut - more resources
Full Text Sources
Other Literature Sources
Molecular Biology Databases
Miscellaneous
