. 2014 Jun 16;25(6):762-77.
doi: 10.1016/j.ccr.2014.04.024.

JARID1B is a luminal lineage-driving oncogene in breast cancer

Affiliations

JARID1B is a luminal lineage-driving oncogene in breast cancer

Shoji Yamamoto et al. Cancer Cell. .

Abstract

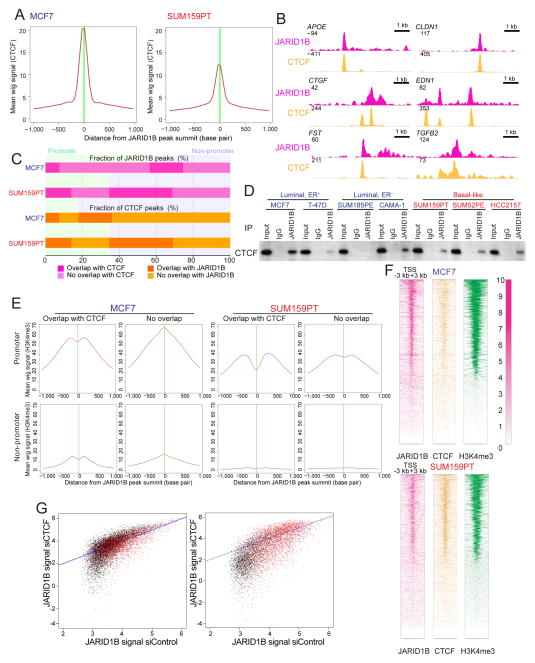
Recurrent mutations in histone-modifying enzymes imply key roles in tumorigenesis, yet their functional relevance is largely unknown. Here, we show that JARID1B, encoding a histone H3 lysine 4 (H3K4) demethylase, is frequently amplified and overexpressed in luminal breast tumors and a somatic mutation in a basal-like breast cancer results in the gain of unique chromatin binding and luminal expression and splicing patterns. Downregulation of JARID1B in luminal cells induces basal genes expression and growth arrest, which is rescued by TGFβ pathway inhibitors. Integrated JARID1B chromatin binding, H3K4 methylation, and expression profiles suggest a key function for JARID1B in luminal cell-specific expression programs. High luminal JARID1B activity is associated with poor outcome in patients with hormone receptor-positive breast tumors.


Figures

Figure 1
Figure 1. JARID1B is a luminal lineage-specific oncogene in breast cancer
(A) A representative image of metaphase FISH analysis of MCF7 luminal ER+ breast cancer cells using JARID1B BAC (green) and chromosome 1 centromeric (red) probes. (B, C) Correlation between JARID1B gene expression (mRNA) and copy number in all tumors (n=1,944) (B) and luminal A (n=711) subset (C) based on the analysis of breast tumors in the METABRIC dataset. r indicates linear correlation coefficient. (D, E) Associations between JARID1B expression and PAM50 (n=1,944) (D) and 10 different breast tumor (integrative clusters, IC10) (n=1,980) (E) subtypes in the METABRIC dataset. Small colored rectangles in panel E indicate the composition of IC10 clusters according to PAM50 subtype. The differences in JARID1B mRNA levels among breast tumor subtypes are statistically significant (see Supplemental Experimental Procedures for details). (F) shRNA clones identified as hits in the cellular viability screen in the indicated cell lines. Colors indicate luminal (blue), basal-like (red), and HER2+ (pink) breast cell lines, respectively. Numbers indicate fraction (%) of viable cells compared to control. Red shading indicates growth inhibition above cut off (75%). See also Figure S1.
Figure 2
Figure 2. The effect of JARID1B on gene expression patterns
(A, B) Hierarchical clustering of breast cancer cell lines by log2(RPKM) based on similarities in the expression pattern of all transcripts (A) and by GFold value of the top 200 genes differentially expressed after siJARID1B (B). Gene expression index is measured by the logarithm of gene’s RPKM value. The genes chosen for clustering in panel (B) are the union of top 200 differentially expressed genes after siJARID1B transfection in each cell line. (C) Measurement of expression changes for selected genes by quantitative RT-PCR. (D) Changes in the expression of basal/stem cell-related genes in siJARID1B-transfected MCF7 cells. (E) Clustering of breast cancer gene expression data from multiple different cohorts based on the top 200 differentially expressed genes with JARID1B promoter binding in the MCF7 cell line following transfection of siJARID1B. Change of expression level in MCF7 after siJARID1B transfection is indicated to the left (Cell-line expr), followed by the difference between luminal A and basal-like samples from all cohorts (Basal-lumA). (F, G) Rescue from JARID1B siRNA-induced growth inhibition by treatment with LY2109761. (F) or by downregulation of SMAD4 or TGFBR2 by siRNAs (G). In all panels, *, p<0.05; **, p<0.001; error bars mark STDEV. See also Figure S2 and Table S1.
Figure 3
Figure 3. JARID1B binding patterns in breast tumor subtypes
(A) Heatmap and hierarchical clustering of JARID1B genomic binding peaks (±3kb around peak summit) in luminal (blue) and basal-like (red) breast cancer cell lines. The JARID1B-mutant HCC2157 cell line is marked with an asterisk and the green rectangle highlights unique peaks. (B) Pie chart of top 10k JARID1B binding peaks location in relation to its distance from TSS. (C) Hierarchical clustering of breast cancer cell lines considering JARID1B binding signals only in non-promoter (left panel) and only in promoter (right panel) regions. Both clusters are significant in terms of p value (using pvclus). (D) Ratio of H3K4me3/H3K4me2 signal at JARID1B peak regions in MCF7 cells transfected with siControl and siJARID1B. P-value for Pearson correlation coefficient of siJARID1B and siControl H3K4me3 signals in JARID1B region (correlation value=0.98999, n=91,992, p value=0). (E) Union of JARID1B, H3K4me3, H3K4me2, and H3K4me1 binding peaks in MCF7 and SUM159PT cell lines. (F) Examples of peak maps and ChIP-qPCR for selected genes. Black bar and a-f indicates primers used for qPCR in the right panel. (G) Examples of H3K4me3 ChIP-qPCR for selected genes in control and siJARID1B transfected cells untreated or treated with LY2109761. (H) Heatmap of JARID1B signal around TSS of all RefSeq genes in breast cancer cell lines. Each row is a gene promoter region centered around TSS. K-mean clustering (k=2) is applied to all genes promoters. Histone marks and gene expression columns are plotted according to the order of genes from the clustering. Gene expression value is the logarithm of RPKM for each gene. In all panels, *, p<0.05; **, p<0.001; error bars mark STDEV. See also Figures S3 and Table S2.
Figure 4
Figure 4. Integrated view of JARID1B activity
(A) Integrated view of siJARID1B differential genes in MCF7 cells and its association with JARID1B, H3K4me2 and H3K4me3 promoter binding signal. Each column is a gene, ranking by the differential gene GFold value comparing siJARID1B with siControl. (B) Two of the highest scoring consensus sequence motifs in top 5,000 JARID1B peaks in MCF7 cells. z-score −87.5043 (top) and −87.3197 (bottom), p value=1e-30. (C) Box plots depict average beta values of DNA methylation for all genes, and genes up or down regulated after expression of siJARID1B. *** marks p<0.001, detailed statistical analysis is included in Supplementary Experimental Procedures. (D) Integrated view of differential gene expression (G-Fold>1, 947 genes), JARID1B, FOXA1, GATA3, ER, and TFAP2C binding at promoters and enhancers in luminal (MCF7 and T-47D combined) and basal (SUM159PT and MDA-MB-231 combined) breast cancer cell lines. Wilcoxon test for basal and luminal JARID1B signal in promoter (W=430557937, p value<2.2e-16) and in enhancer (W=511285604, p value<2.2e-16). See also Figure S4.
Figure 5
Figure 5. Clinical relevance of JARID1B activity in breast tumors
Associations between MCF7 (A) and SUM159PT (B) PARADIGM JARID1B activity indices and disease-specific survival in breast cancer patients with ER+ and ER tumors. Red, green, and blue colors indicate positive, negative, and zero JARID1B activity. “end treat” indicates endocrine treatment only. See also Tables S3-S4.
Figure 6
Figure 6. JARID1B-CTCF interaction
(A) CTCF enrichment around JARID1B peak summits in both MCF7 and SUM159PT cells. (B) Examples of JARID1B-CTCF overlap in MCF7 cells based on visualization of ChIP-seq data for the indicated genes. (C) Bar graphs depicting JARID1B and CTCF overlap at promoter and non-promoter sites in MCF7 and SUM159PT cell lines. The differences between JARID1B-only and JARID1B-CTCF overlapping sites in non-promoter and promoter regions are statistically significant both in MCF7 and SUM159PT cells (p<2.2e-16, Fisher exact test). (D) Immunoblots showing the immunoprecipitation of JARID1B and CTCF in breast cancer cell lines. (E) H3K4me3 signal profile around JARID1B peak summit in MCF7 and SUM159PT cell lines. (F) JARID1B, CTCF, and H3K4me3 signal around all promoters in MCF7 and SUM159PT cell lines. Gene promoters are ranked by the average signal of H3K4me3. The JARID1B and CTCF signal are significantly different between MCF7 and SUM159PT cells (p value<2.2e-16, Wilcoxon test). (G) Changes in JARID1B chromatin binding in promoter peaks (left panel) and non-promoter peaks (right panel) following transfection of siCTCF in MCF7 cells. Red dots mark JARID1B-CTCF overlapping sites. See also Figure S5 and Table S5.
Figure 7
Figure 7. JARID1B gain of function mutation in HCC2157 cells
(A) Schematic structure of JARID1B gene with exons, functional protein domains, and the location of somatic mutations identified in various human cancer types. (B) Heatmap of clustering of samples based on the expression of genes associated with HCC2157-unique peaks. (C) Heatmap showing the differential expression of a subset of genes (top 500 genes with higher expression in HCC2157 cells compared to other basal lines) associated with HCC2157-unique JARID1B peaks. “Cell line expr” indicates transcript levels in HCC2157 cells, Basal-lumA denotes difference in expression level between basal and luminal tumors, where blue indicates higher expression in the latter group. Green rectangle highlights luminal genes highly expressed in HCC2157 cells. (D) ChIP-qPCR analysis of enrichment for HCC2157-unique JARID1B peaks by Myc-tagged wild type and mutant (K1435R) JARID1B transfected into SUM159PT cells. * and ** asterisks indicate p<0.05 and p<0.001, respectively, whereas error bars mark STDEV. Inset shows immunoblot analysis of exogenously expressed Myc-tagged wild type and K1435R mutant JARID1B in SUM159PT cells. (E) Degree of enrichment of CTCF binding sites in JARID1B all peaks (left panel) and unique peaks (right panels) in the HCC2157 cell line. (F) Immunoblots showing the immunoprecipitation of CTCF in wild type or K1435R JARID1B mutant cells. (G) Patterns of H3K4me3 and H3K4me2 signal profile around common and HCC2157-unique JARID1B peak summit. See also Figure S6.

References

    1. Almendro V, Cheng YK, Randles A, Itzkovitz S, Marusyk A, Ametller E, Gonzalez-Farre X, Munoz M, Russnes HG, Helland A, et al. Inference of Tumor Evolution during Chemotherapy by Computational Modeling and In Situ Analysis of Genetic and Phenotypic Cellular Diversity. Cell reports 2014 - PMC - PubMed
    1. Bernardo GM, Lozada KL, Miedler JD, Harburg G, Hewitt SC, Mosley JD, Godwin AK, Korach KS, Visvader JE, Kaestner KH, et al. FOXA1 is an essential determinant of ERalpha expression and mammary ductal morphogenesis. Development. 2010;137:2045–2054. - PMC - PubMed
    1. Bessarabova M, Pustovalova O, Shi W, Serebriyskaya T, Ishkin A, Polyak K, Velculescu VE, Nikolskaya T, Nikolsky Y. Functional synergies yet distinct modulators affected by genetic alterations in common human cancers. Cancer Res. 2011;71:3471–3481. - PubMed
    1. Catchpole S, Spencer-Dene B, Hall D, Santangelo S, Rosewell I, Guenatri M, Beatson R, Scibetta AG, Burchell JM, Taylor-Papadimitriou J. PLU-1/JARID1B/KDM5B is required for embryonic survival and contributes to cell proliferation in the mammary gland and in ER+ breast cancer cells. Int J Oncol. 2011;38:1267–1277. - PubMed
    1. Christensen J, Agger K, Cloos PA, Pasini D, Rose S, Sennels L, Rappsilber J, Hansen KH, Salcini AE, Helin K. RBP2 belongs to a family of demethylases, specific for tri-and dimethylated lysine 4 on histone 3. Cell. 2007;128:1063–1076. - PubMed

Publication types

MeSH terms

Associated data

LinkOut - more resources