. 2014 Sep;2(9):890-900.
doi: 10.1158/2326-6066.CIR-13-0199-T. Epub 2014 Jun 17.

IL32 is progressively expressed in mycosis fungoides independent of helper T-cell 2 and helper T-cell 9 polarization

Affiliations

IL32 is progressively expressed in mycosis fungoides independent of helper T-cell 2 and helper T-cell 9 polarization

Hanako Ohmatsu et al. Cancer Immunol Res. 2014 Sep.

Abstract

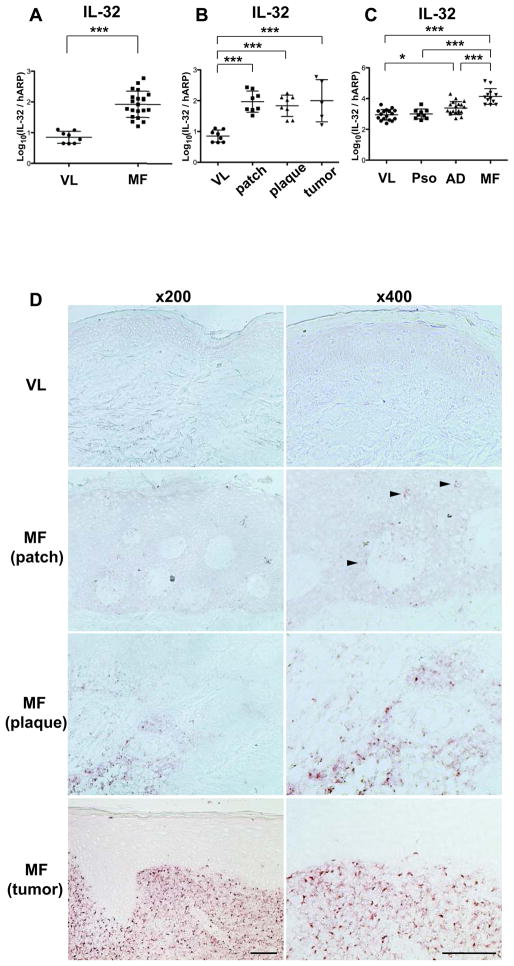
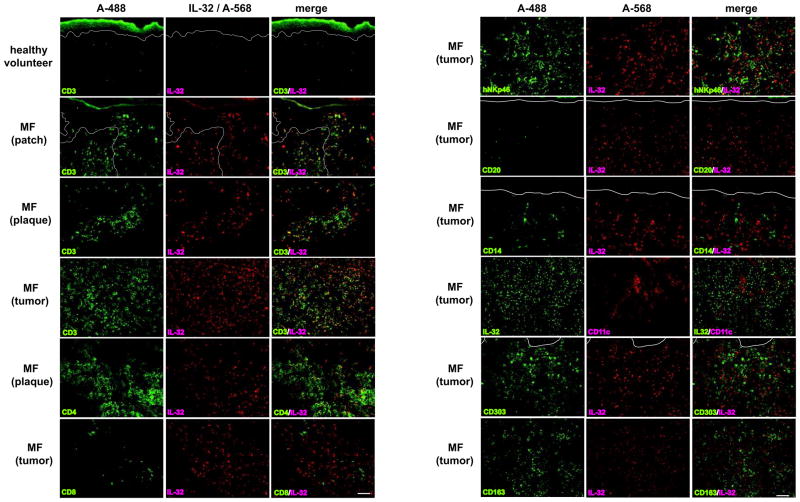
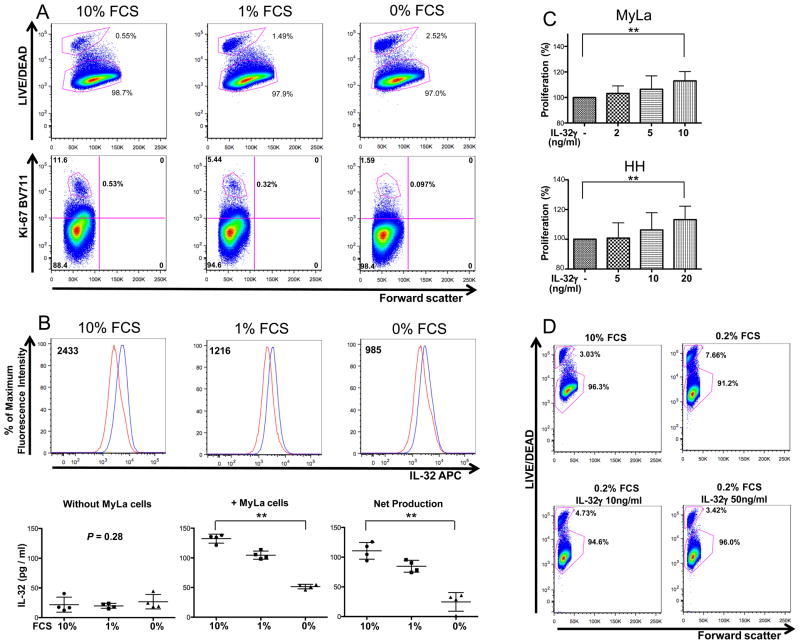
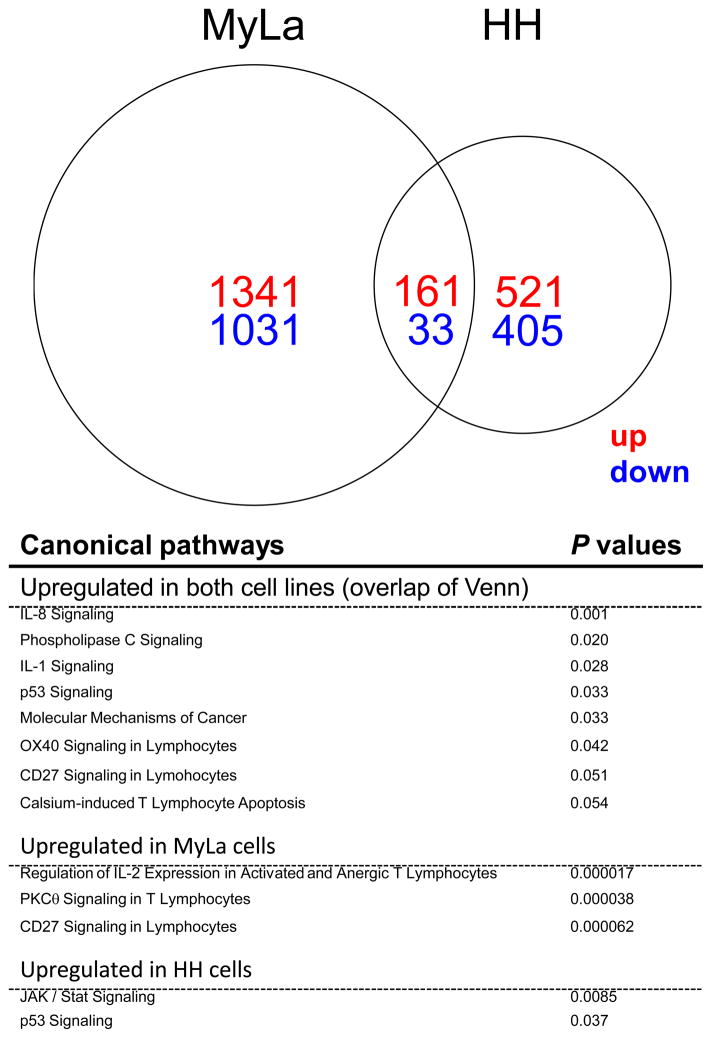
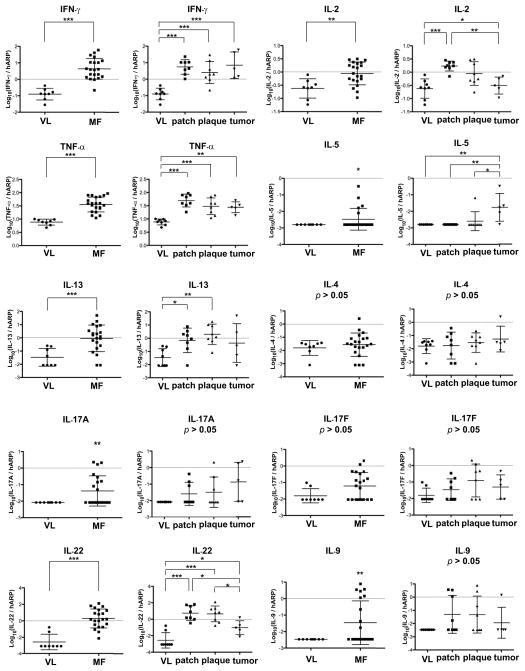
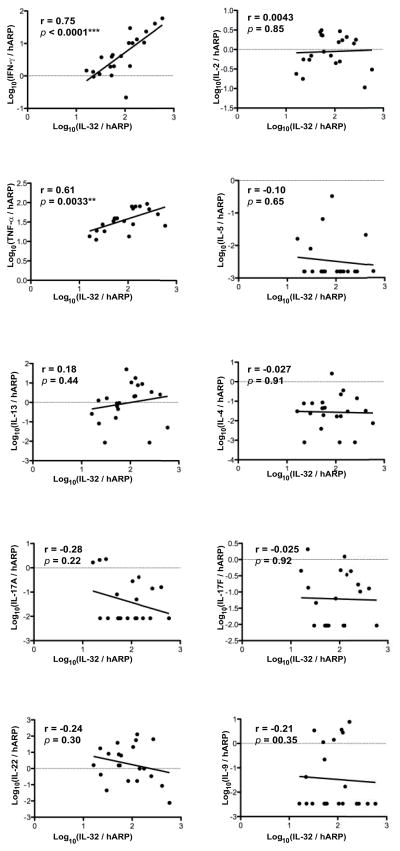
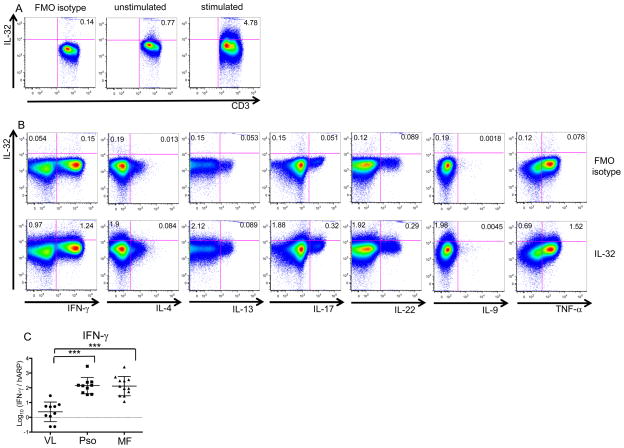
Mycosis fungoides, the most common type of cutaneous T-cell lymphoma (CTCL), is characterized by a helper T-cell 2 (Th2) skewing with a mature CD4(+) memory T-cell phenotype. Using skin samples from patients with mycosis fungoides (n = 21), healthy volunteers (n = 17), and individuals with atopic dermatitis (n = 17) and psoriasis (n = 9), we found IL32 mRNA expression significantly higher in mycosis fungoides samples than in samples from benign inflammatory skin diseases, and its expression increases with disease progression. By IHC and immunofluorescence, we confirmed IL32 protein expression in many CD3(+)CD4(+) T cells and some epidermotropic T cells in mycosis fungoides lesions. MyLa cells (a mycosis fungoides cell line) express IL32, which, in turn, could promote cellular proliferation and viability in a dose-dependent fashion. IL32-treated MyLa and CTCL HH cells upregulated cell proliferation and survival genes. Of the major "polarizing" T-cell cytokines, only IFNγ mRNA increases with mycosis fungoides progression and positively correlates with IL32 mRNA expression. Th2 cytokines do not positively correlate with IL32 mRNA expression or mycosis fungoides progression. Furthermore, by flow cytometry, IL32 production by circulating activated T cells in healthy individuals was found in both IFNγ(+) and IFNγ(-) cells but not in IL4(+) or IL13(+) cells. In conclusion, we have identified IL32(+) cells as the likely tumor cells in mycosis fungoides, and demonstrated that IL32 mRNA expression increases with mycosis fungoides progression and is significantly higher than mRNA expression in other skin diseases, and that some IL32(+) T cells are independent from the defined Th subsets. Thus, IL32 may play a unique role in mycosis fungoides progression as an autocrine cytokine.


Conflict of interest statement

Conflicts of interest: The authors state no conflict of interest.

Figures

Figure 1
Figure 1
IL-32 is highly expressed in MF lesional skin. A–C, IL-32 mRNA levels using skin (VL; healthy volunteers, MF / patch stage, plaque stage, tumor stage, Pso, AD). Data in Fig. 1C are from a different experiment than those in Fig. 1A–B. Horizontal bars are mean ± SD. *P<0.05, ***P<0.001. D, Immunohistochemistry for IL-32 using skin from VL and MF patients (patch, plaque, and tumor stage). Arrows show cells positive for IL-32. Magnification, ×200 (left panels) and ×400 (right panels). Scale bar represents 100μm.
Figure 2
Figure 2
CD4+ T-cells are the main source for IL-32+ cells. Immunofluorescence using skin samples from healthy volunteers and MF patients. A-488 labeled CD3, CD4, CD8, hNKp46, CD20, CD14, IL-32, CD303 or CD163 (left panels) and A-568 labeled IL-32 or CD11c (center panels) are shown, with merged images in right panels. White lines indicate the epidermis-dermis junctions. Magnification at ×200. Scale bar represents 100μm.
Figure 3
Figure 3
IL-32 facilitates cell proliferation and augments viability of CTCL cells. A, After MyLa cells were cultured in media with the indicated FCS concentrations for 40 hours, they were stained with LIVE/DEAD (top panels), Ki-67 (bottom panels). B, After MyLa cells were cultured in media with the indicated FCS concentrations for 40 hours, they were stained with IL-32 (top panels). Red and blue lines represent FMO isotype-control and APC-IL-32 antibodies, respectively. Numbers represent the median fluorescence intensity value’s difference between FMO isotype-control and APC-IL-32. In bottom panels, IL-32 production in media including indicated FCS concentrations without MyLa cells (left panel), and in media containing indicated FCS concentrations with MyLa cells (center panel) are shown. In the right panel, we show the net production of IL-32 by MyLa cells cultured in indicated FCS concentrations (values shown in the left panel were subtracted from those shown in the center panel). C, After MyLa cells and HH cells were cultured in media containing 0.1% FCS with and without IL-32γ for 40 hours, cell proliferation rates were analyzed by using WST-1 assay. n=4–7. Values are mean ± SD. **P<0.01. D, After MyLa cells were cultured in the four conditions shown in the panels for 18 hours, they were analyzed for LIVE/DEAD expression. A, B (top panels), D, Representative results. A, B, D, experiments were done three times.
Figure 4
Figure 4
IL-32 prompts cell activation and cancer related pathways. A Venn diagram reveals the numbers of up-regulated (red) and down-regulated (blue) probe sets in IL-32-treated MyLa cells and / or HH cells. Significantly up-regulated canonical pathways (p<0.05) and selected canonical pathways (with p values close to 0.05) in IL-32-treated MyLa cells and / or HH cells are shown with P values.
Figure 5
Figure 5
Only IFNγ shows consistently increased mRNA expression in MF lesions. mRNA expression levels of various cytokines in the skin of VL and MF. Horizontal bars are mean ± SD. For IL-5, IL-17A, and IL-9 mRNA expression levels, a one sample t-test was done to compare the non-identical values to the identical values only in MF lesions. The percentages of samples showing non-identical values are 23.8% (IL-5), 42.9% (IL-17A) and 42.9% (IL-9). *P<0.05, **P<0.01, ***P<0.001.
Figure 6
Figure 6
Only IFNγ and TNF-α show positive, significant correlations with IL-32 mRNA expression in MF lesions, while Th2 cytokines do not. Correlations between mRNA expression levels of IL-32 (x-axis) and other cytokines (y-axis). **P<0.01, ***P<0.001.
Figure 7
Figure 7
IL-32 production is detected in both IFNγ+ and IFNγ cells in whole blood from healthy volunteers. A, B, Whole blood samples from healthy volunteers were stained with indicated antibodies. A, no stimulation (center panel) and stimulation with PMA/Ionomycin for 4 hours (right panel). B, stimulation with PMA/Ionomycin for 4 hours. A, B, Panels show a representative experiment out of three. C, IFNγ mRNA levels using skin (VL, Pso, MF). Horizontal bars are mean ± SD. ***P<0.001.

References

    1. Wong HK, Mishra A, Hake T, Porcu P. Evolving insights in the pathogenesis and therapy of cutaneous T-cell lymphoma (mycosis fungoides and Sezary syndrome) Br J Haematol. 2011;155:150–66. - PMC - PubMed
    1. Criscione VD, Weinstock MA. Incidence of cutaneous T-cell lymphoma in the United States, 1973–2002. Arch Dermatol. 2007;143:854–9. - PubMed
    1. Weinstock MA, Gardstein B. Twenty-year trends in the reported incidence of mycosis fungoides and associated mortality. Am J Public Health. 1999;89:1240–4. - PMC - PubMed
    1. Benton EC, Crichton S, Talpur R, Agar NS, Fields PA, Wedgeworth E, et al. A cutaneous lymphoma international prognostic index (CLIPi) for mycosis fungoides and Sezary syndrome. Eur J Cancer. 2013;49:2859–68. - PubMed
    1. Vowels BR, Lessin SR, Cassin M, Jaworsky C, Benoit B, Wolfe JT, et al. Th2 cytokine mRNA expression in skin in cutaneous T-cell lymphoma. J Invest Dermatol. 1994;103:669–73. - PubMed

Publication types