. 2014 Jun 18:5:4148.
doi: 10.1038/ncomms5148.

Enhanced carrier multiplication in engineered quasi-type-II quantum dots

Affiliations
Free PMC article

Enhanced carrier multiplication in engineered quasi-type-II quantum dots

Claudiu M Cirloganu et al. Nat Commun. .
Free PMC article

Abstract

One process limiting the performance of solar cells is rapid cooling (thermalization) of hot carriers generated by higher-energy solar photons. In principle, the thermalization losses can be reduced by converting the kinetic energy of energetic carriers into additional electron-hole pairs via carrier multiplication (CM). While being inefficient in bulk semiconductors this process is enhanced in quantum dots, although not sufficiently high to considerably boost the power output of practical devices. Here we demonstrate that thick-shell PbSe/CdSe nanostructures can show almost a fourfold increase in the CM yield over conventional PbSe quantum dots, accompanied by a considerable reduction of the CM threshold. These structures enhance a valence-band CM channel due to effective capture of energetic holes into long-lived shell-localized states. The attainment of the regime of slowed cooling responsible for CM enhancement is indicated by the development of shell-related emission in the visible observed simultaneously with infrared emission from the core.


Figures

Figure 1
Figure 1. Photon-to-charge-carrier conversion without and with carrier multiplication.
(a) Energy losses in a photovoltaic device arise from fast cooling of hot carriers generated by high-energy photons with ħω>Eg (thermalization loss) and the fact that low-energy photons with ħω<Eg are transmitted through the active layer without being absorbed (transparency loss). (b) CM can be explained in terms of an impact-ionization-like scattering between a hot carrier (a conduction-band electron in the example in the figure) and a pre-existing valence band electron, which is promoted to the conduction band producing an additional electron-hole pair.
Figure 2
Figure 2. Schematic representations of electronic states in core/shell and core-only QDs.
(a) Representation of a PbSe/CdSe core/shell QD with a thick shell and the approximate structure of electronic states for a QD with 2 nm core radius and 2 nm shell thickness. The QD energy spectrum features closely spaced electron levels and sparsely distributed hole core levels (with a typical energy separation depicted as ΔEcool). Red arrows indicate excess energies for the electron and the hole, Ee and Eh, respectively, demonstrating the asymmetric distribution of the photon excess energy (ħωEg) between the two carriers (Eh>Ee), which could allow for shifting the CM threshold closer to the fundamental 2Eg limit. Relaxation of a hot hole from a shell-based state to a core-localized level can happen either via a CM process (straight black lines) or thermalization (dotted black line). Here, the pre-existing core-localized valence-band electrons interacting in the CM process are spatially separated by the distance dee, which is much smaller than the overall QD size. The photogenerated and pre-existing carriers are shown by solid and dashed circles, respectively. (b) Band structure and relaxation processes in a core-only PbSe QD of the same overall size. For this structure, the salient differences are mirror-symmetric conduction and valence-band states, which results in a symmetric distribution of the photon excess energy between the electron and the hole, and a larger spatial separation of the carriers interacting in CM.
Figure 3
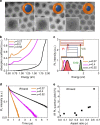
Figure 3. Structural and spectroscopic characterization of core/shell QDs.
(a) TEM images showing typical core/shell QDs with aspect ratios of 0.27, 0.4 and 0.52, and a constant overall radius of 4 nm. Scale bars, 10 nm. Insets are higher resolution images (scale bars, 2 nm) of individual QDs. (b) Absorption spectra for the same QDs, indicating a blue shift and a decrease in amplitude of the first excitonic peak associated with the 1Se−1Sh transition with increasing shell thickness. Spectra are shifted vertically for clarity. (c) PL spectra for the same QDs, showing progressive blue shifts with increasing shell size and the emergence of visible emission for the QDs with the thickest shell (shaded spectra). Inset shows a schematic representation of the band structure, indicating the transitions associated with the infrared and visible emission. All infrared spectra are normalized, whereas for the thick-shell structure the visible emission amplitude is multiplied by a factor of 60 for the purpose of comparison. (d) Infrared PL traces (core emission) are characterized by microsecond time constants and indicate a progressive increase in single-exciton lifetime (from 0.42 to 1.2 μs, and then 2.6 μs for the plotted traces) for structures with larger shell thicknesses, which is a typical signature of a quasi-type-II regime. (e) The PL quantum yield of the infrared band increases with increasing aspect ratio.
Figure 4
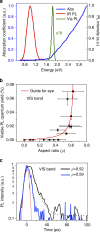
Figure 4. Spectral and temporal characteristics of shell-related visible PL.
(a) Absorption (blue line) and two-band PL (red and green lines) spectra of a thick-shell PbSe/CdSe QD sample with ρ=0.64. (b) Visible PL quantum yields plotted as a function of aspect ratio show a sharp growth of the emission efficiency for ρ>0.5, suggesting a significant reduction in the intraband cooling rate for shell-localized holes; horizontal and vertical error bars are defined by, respectively, the QD sample size dispersion (s.d. of aspect ratios based on TEM studies) and the noise level (evaluated in terms of s.d.) of the measurements factoring into the PL quantum yield determination. (c) Dynamics of visible PL originating from the CdSe shell is controlled by relaxation of shell-localized holes. Relaxation time constants for samples with ρ=0.52 and 0.59 are 6 ps (blue traces) and 10 ps (black traces), respectively (solid lines are the measurements, dashes are the exponential fits); red line is the measured pump pulse, which defines the width of the instrument response function. All spectroscopic measurements were conducted using low excitation powers for which the average per-dot excitonic occupancy did not exceed 0.1.
Figure 5
Figure 5. Auger decay in core/shell PbSe/CdSe QDs compared with core-only samples.
(a) Schematic representation of biexciton Auger decay in a thick-shell PbSe/CdSe QD. In these structures, it is dominated by Coulomb scattering between the two core-localized holes whereby one hole is transferred to the conduction band and the other is excited within the valence band. For the structures with enhanced CM (ρ=0.6–0.7), the excess energy is not sufficiently high to promote the hole above the CdSe valence-band edge. (b) The measured biexciton lifetimes as a function of aspect ratio for the PbSe/CdSe structures with the same overall radius of 4 nm and ρ from 0.42 to 0.64 (blue symbols). The black and red symbols correspond to core-only PbSe and CdSe QDs, respectively; for both samples the QD radius is ca. 4 nm, that is, similar to the total radius of the core/shell structures. The τ2A constants measured for the PbSe/CdSe core/shell QDs are considerably shorter compared with those for either core-only PbSe or CdSe QDs, indicating an increase in CM-relevant Coulomb coupling between core-localized charges. Horizontal and vertical error bars are defined by, respectively, the QD samples’ size dispersion (from TEM measurements) and the quality of the exponential fits (least squares method, using a global fit across all fluences) to the measured biexciton dynamics.
Figure 6
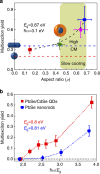
Figure 6. CM efficiency for core/shell QDs of varying aspect ratios.
(a) Multiexciton yields measured for PbSe/CdSe core/shell structures with progressively increasing shell thicknesses (3.1 eV excitation). The QDs have different total sizes but similar band gaps (~0.87 eV) for proper comparison and are represented by different colour squares on the plot (black dashed line is a guide to the eye). The region where energy conservation is met and, simultaneously, slow cooling is observed (green shading) corresponds to the highest CM yields. The CM yields for PbSe QDs and PbSe nanorods (as interpolated from ref. 34) of similar band gaps are shown by red and blue dashed lines, respectively. Horizontal and vertical error bars are defined by, respectively, the QD samples’ size dispersion (from TEM studies) and the quality of the modified Poissonian fits (according to a previously reported method52) to the measured exciton multiplicities plotted as a function of pump fluence. (b) CM threshold measurements for a core/shell sample with Eg=0.8 eV (red squares) and PbSe nanorods with Eg=0.81 eV (blue circles) using the output of a tunable parametric amplifier, as well as the fundamental-frequency and the second-harmonic outputs of a Ti:sapphire laser (vertical error bars are determined in same way as in a). These data indicate a significant reduction of the CM threshold in the core/shell QDs, approaching the fundamental 2Eg limit. The CM threshold in the nanorods is ca. 2.5Eg.

Similar articles

Cited by

References

    1. Shockley W. & Queisser H. J. Detailed balance limit of efficiency of p-n junction solar cells. J. Appl. Phys. 32, 510–519 (1961).
    1. Wang X. et al. Tandem colloidal quantum dot solar cells employing a graded recombination layer. Nat. Photon. 5, 480–484 (2011).
    1. Dou L. et al. Tandem polymer solar cells featuring a spectrally matched low-bandgap polymer. Nat. Photon. 6, 180–185 (2012).
    1. Luque A. & Martí A. Increasing the efficiency of ideal solar cells by photon induced transitions at intermediate levels. Phys. Rev. Lett. 78, 5014–5017 (1997).
    1. Luque A., Marti A. & Stanley C. Understanding intermediate-band solar cells. Nat. Photon. 6, 146–152 (2012).

Publication types