

The role of concentration-effect relationships in the assessment of QTc interval prolongation
- PMID: 24938719
- PMCID: PMC4294082
- DOI: 10.1111/bcp.12443
The role of concentration-effect relationships in the assessment of QTc interval prolongation
Abstract
Population pharmacokinetic and pharmacokinetic-pharmacodynamic (PKPD) modelling has been widely used in clinical research. Yet, its application in the evaluation of cardiovascular safety remains limited, particularly in the evaluation of pro-arrhythmic effects. Here we discuss the advantages of disadvantages of population PKPD modelling and simulation, a paradigm built around the knowledge of the concentration-effect relationship as the basis for decision making in drug development and its utility as a guide to drug safety. A wide-ranging review of the literature was performed on the experimental protocols currently used to characterize the potential for QT interval prolongation, both pre-clinically and clinically. Focus was given to the role of modelling and simulation for design optimization and subsequent analysis and interpretation of the data, discriminating drug from system specific properties. Cardiovascular safety remains one of the major sources of attrition in drug development with stringent regulatory requirements. However, despite the myriad of tests, data are not integrated systematically to ensure accurate translation of the observed drug effects in clinically relevant conditions. The thorough QT study addresses a critical regulatory question but does not necessarily reflect knowledge of the underlying pharmacology and has limitations in its ability to address fundamental clinical questions. It is also prone to issues of multiplicity. Population approaches offer a paradigm for the evaluation of drug safety built around the knowledge of the concentration-effect relationship. It enables quantitative assessment of the probability of QTc interval prolongation in patients, providing better guidance to regulatory labelling and understanding of benefit/risk in specific populations.
Keywords: ICH E14; PKPD modelling; QTc interval prolongation; cardiovascular safety; clinical trial simulations; drug development.
© 2014 The British Pharmacological Society.
Figures
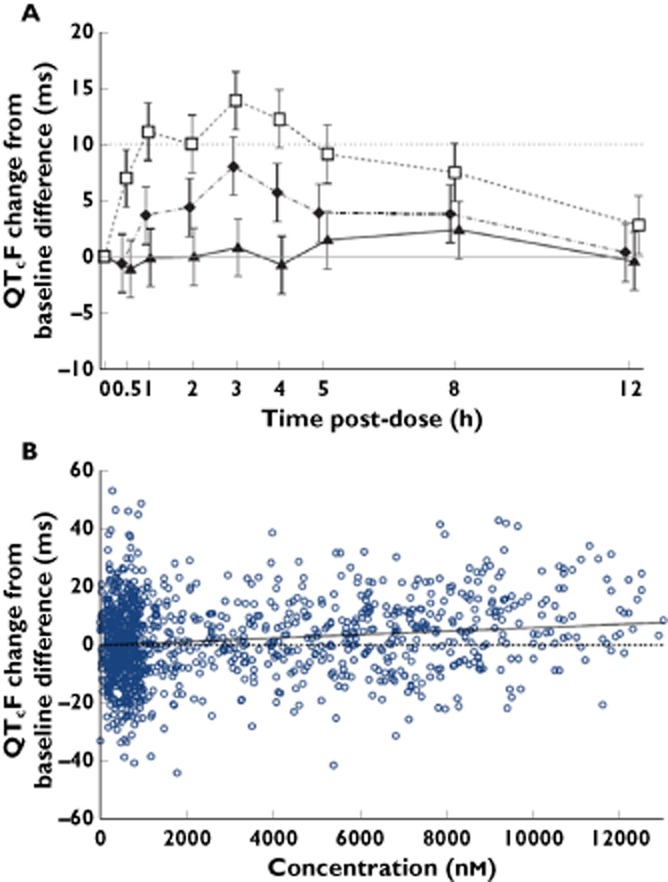
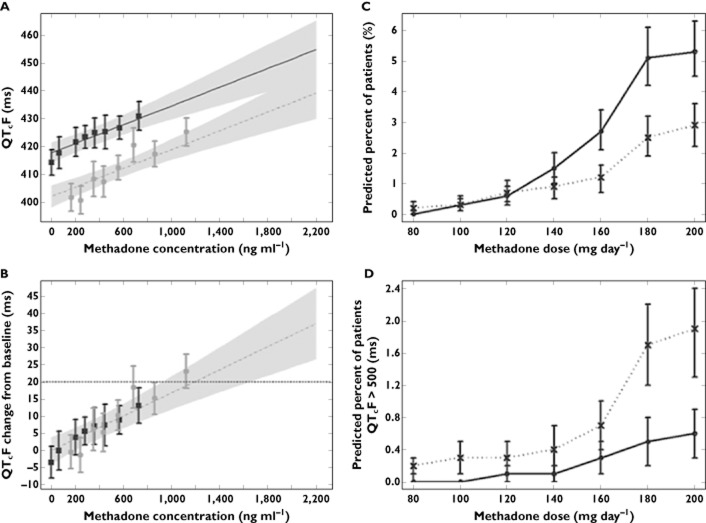
 , 100 mg MK-0431;
  , 800 mg MK-0431;
  , moxifloxacin;
  , observed;
  , predicted mean;
  , slope = 0

Comment in
-
The role of concentration--effect relationships in the QTc interval prolongation: case sotalol.Br J Clin Pharmacol. 2015 Jun;79(6):1040-1. doi: 10.1111/bcp.12574. Br J Clin Pharmacol. 2015. PMID: 25534550 Free PMC article. No abstract available.
-
On the role of concentration-effect relationships in safety pharmacology: only the dose makes a drug not to be poison!Br J Clin Pharmacol. 2015 Jun;79(6):1042-3. doi: 10.1111/bcp.12593. Br J Clin Pharmacol. 2015. PMID: 25612662 Free PMC article. No abstract available.
References
-
- Lasser KE, Allen PD, Woolhandler SJ, Himmerlstein DU, Wolfe SM, Bor DH. Timing of new black box warnings and withdrawals for prescription medications. JAMA. 2002;287:2215–2220. - PubMed
-
- Guidance for Industry. 2005. E14 clinical evaluation of QT/QTc interval prolongation and proarrythmic potential for non-antiarrythmic drugs.
-
- ICH S7B guidance. 2005. The non-clinical evaluation of the potential for delayed ventricular repolarization (QT interval prolongation). International Conference on Harmonisation of Technical Requirements for Registration of Pharmaceuticals for Human Use.
-
- Hutmacher MM, Chapel S, Agin MA, Fleishaker JC, Lalonde RL. Performance characteristics for some typical QT study designs under the ICH E-14 guidance. J Clin Pharmacol. 2008;48:215–224. - PubMed
-
- Nuttall GA, Eckerman KM, Jacob KA, Pawlaski EM, Wigersma SK, Marienau ME, Oliver WC, Narr BJ, Ackerman MJ. Does low-dose droperidol administration increase the risk of drug-induced QT prolongation and torsade de pointes in the general surgical population? Anesthesiology. 2007;107:531–536. - PubMed
Publication types
MeSH terms
LinkOut - more resources
Full Text Sources
Other Literature Sources
Medical
