

Formation mechanism and optimization of highly luminescent N-doped graphene quantum dots
- PMID: 24938871
- PMCID: PMC4061557
- DOI: 10.1038/srep05294
Formation mechanism and optimization of highly luminescent N-doped graphene quantum dots
Erratum in
-
CORRIGENDUM: Formation mechanism and optimization of highly luminescent N-doped graphene quantum dots.Sci Rep. 2015 Jan 16;5:7998. doi: 10.1038/srep07998. Sci Rep. 2015. PMID: 25591720 Free PMC article. No abstract available.
Abstract
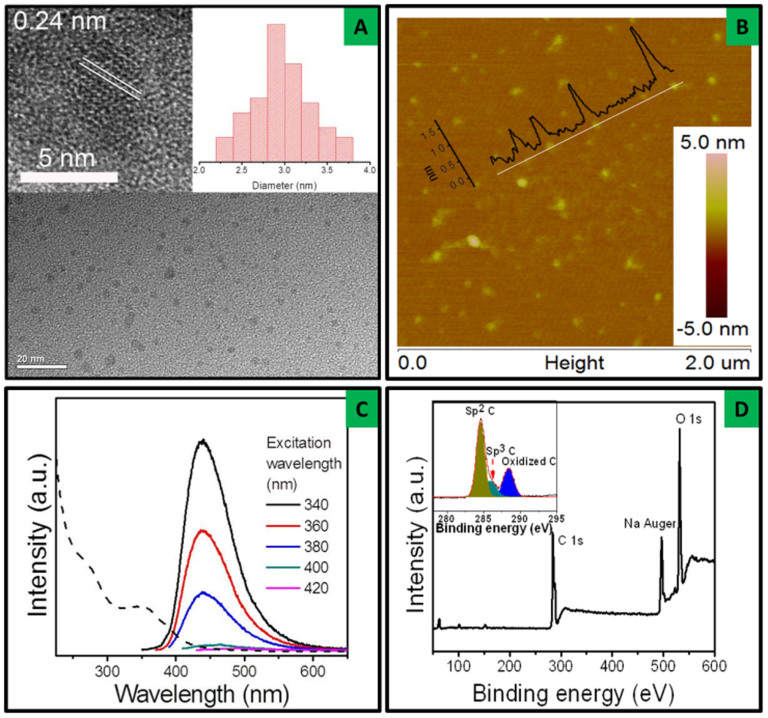
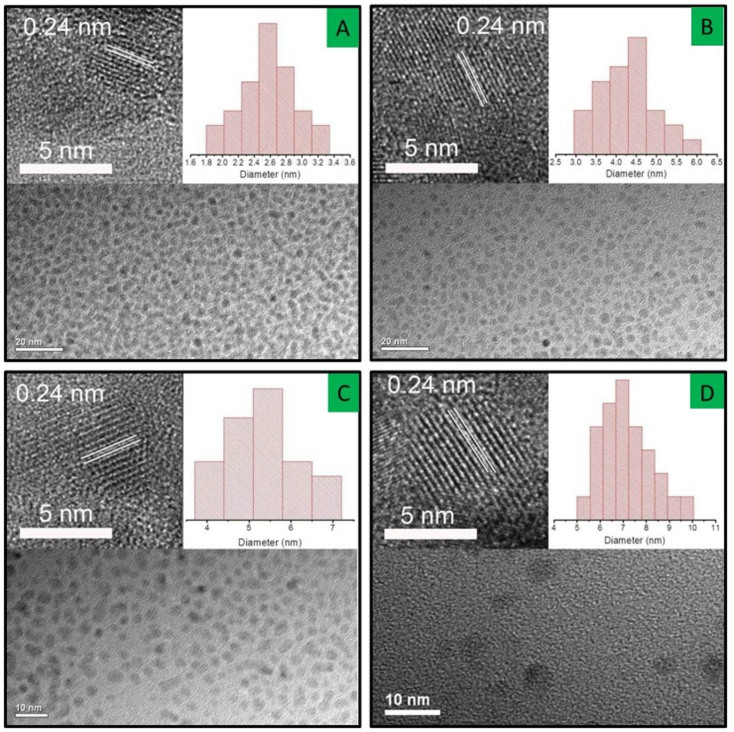
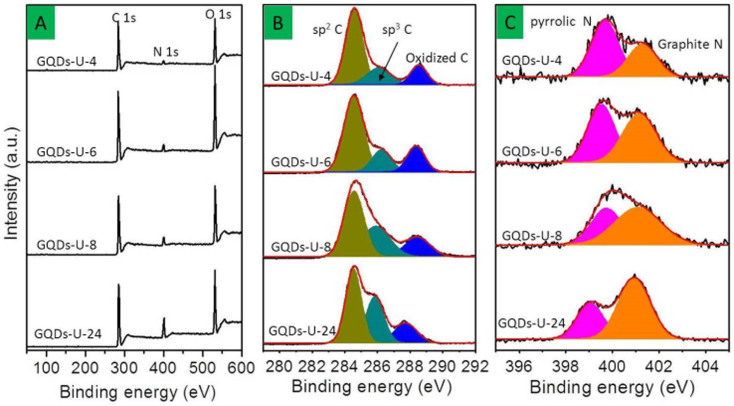
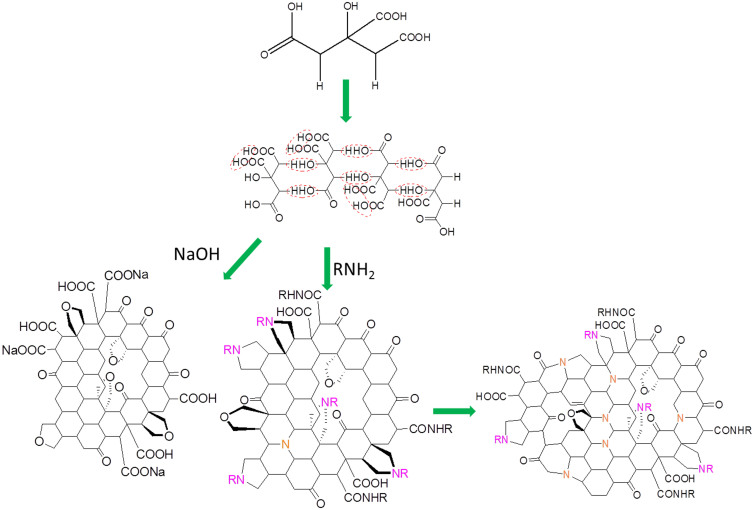
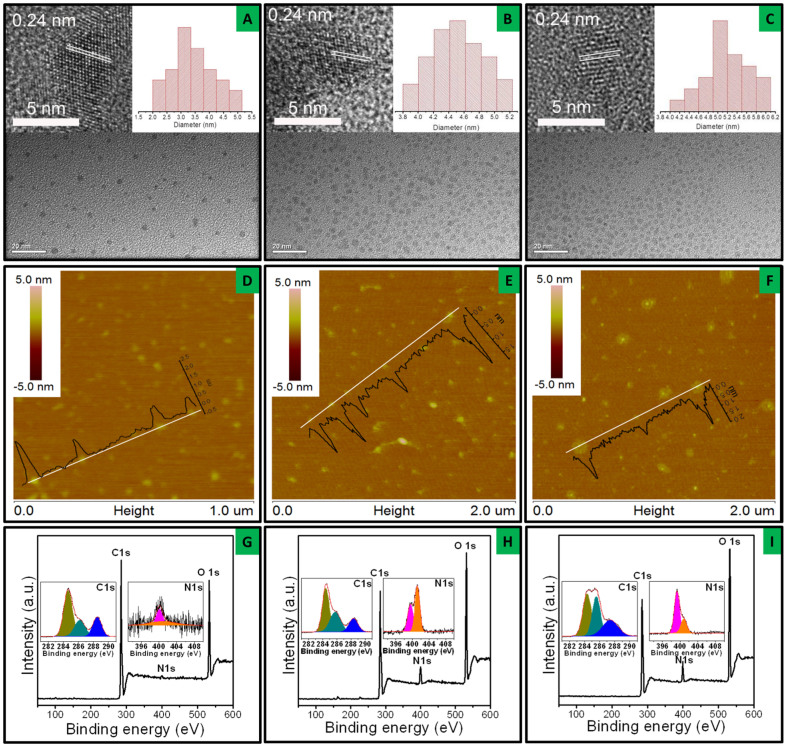
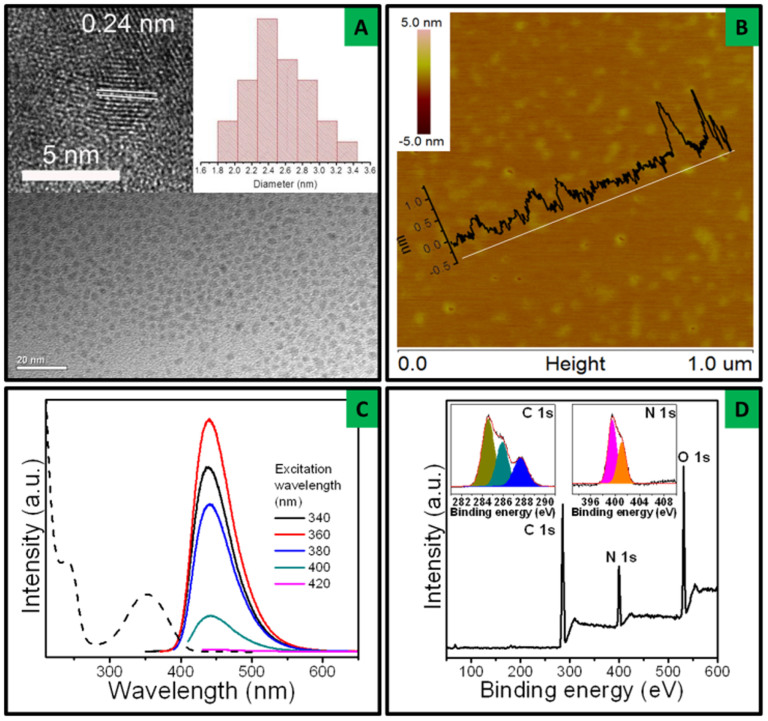
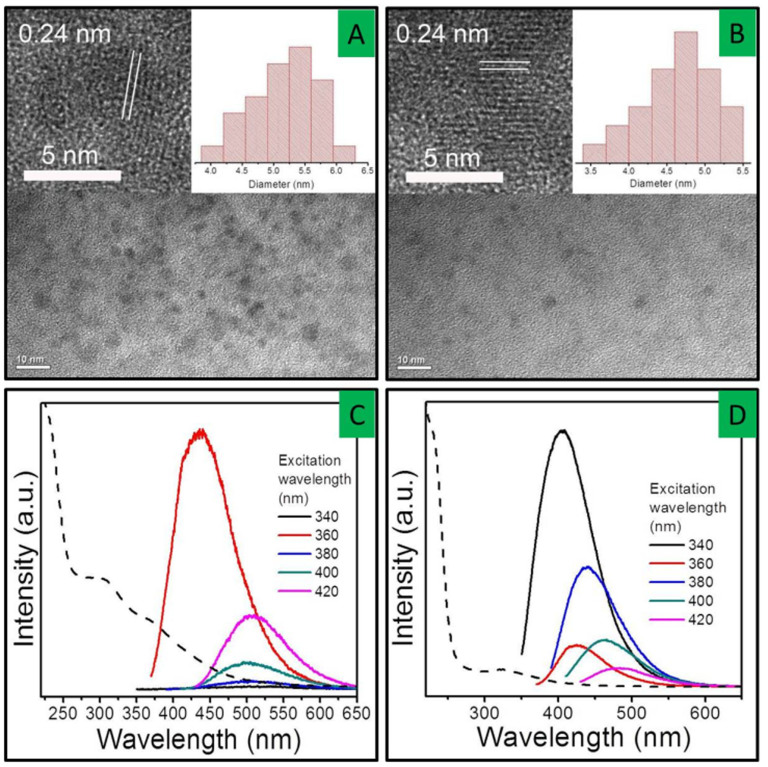
Photoluminescent graphene quantum dots (GQDs) have received enormous attention because of their unique chemical, electronic and optical properties. Here a series of GQDs were synthesized under hydrothermal processes in order to investigate the formation process and optical properties of N-doped GQDs. Citric acid (CA) was used as a carbon precursor and self-assembled into sheet structure in a basic condition and formed N-free GQD graphite framework through intermolecular dehydrolysis reaction. N-doped GQDs were prepared using a series of N-containing bases such as urea. Detailed structural and property studies demonstrated the formation mechanism of N-doped GQDs for tunable optical emissions. Hydrothermal conditions promote formation of amide between -NH₂ and -COOH with the presence of amine in the reaction. The intramoleculur dehydrolysis between neighbour amide and COOH groups led to formation of pyrrolic N in the graphene framework. Further, the pyrrolic N transformed to graphite N under hydrothermal conditions. N-doping results in a great improvement of PL quantum yield (QY) of GQDs. By optimized reaction conditions, the highest PL QY (94%) of N-doped GQDs was obtained using CA as a carbon source and ethylene diamine as a N source. The obtained N-doped GQDs exhibit an excitation-independent blue emission with single exponential lifetime decay.
Figures
References
-
- Ritter K. A. & Lyding J. W. The Influence of Edge Structure on the Electronic Properties of Graphene Quantum Dots and Nanoribbons. Nat. Mater. 8, 235–242 (2009). - PubMed
-
- Baker S. N. & Baker G. A. Luminescent Carbon Nanodots: Emergent Nanolights. Angew. Chem. Int. Ed. 49, 6726–6744 (2010). - PubMed
-
- Shen J., Zhu Y., Yang X. & Li C. Graphene Quantum Dots: Emergent Nanolights for Bioimaging, Sensors, Catalysis and Photovoltaic Devices. Chem. Commun. 48, 3686–3699 (2012). - PubMed
-
- Li L.-S. & Yan X. Colloidal Graphene Quantum Dots. J. Phys. Chem. Lett. 1, 2572–2576 (2010).
-
- Li L., Wu G., Yang G., Peng J., Zhao J. & Zhu J.-J. Focusing on Luminescent Graphene Quantum Dots: Current Status and Future Perspectives. Nanoscale 5, 4015–4039 (2013). - PubMed
Publication types
LinkOut - more resources
Full Text Sources
Other Literature Sources
Molecular Biology Databases
