. 2014 Jun 18:5:4081.
doi: 10.1038/ncomms5081.

Cell cycle transition from S-phase to G1 in Caulobacter is mediated by ancestral virulence regulators

Affiliations
Free PMC article

Cell cycle transition from S-phase to G1 in Caulobacter is mediated by ancestral virulence regulators

Coralie Fumeaux et al. Nat Commun. .
Free PMC article

Abstract

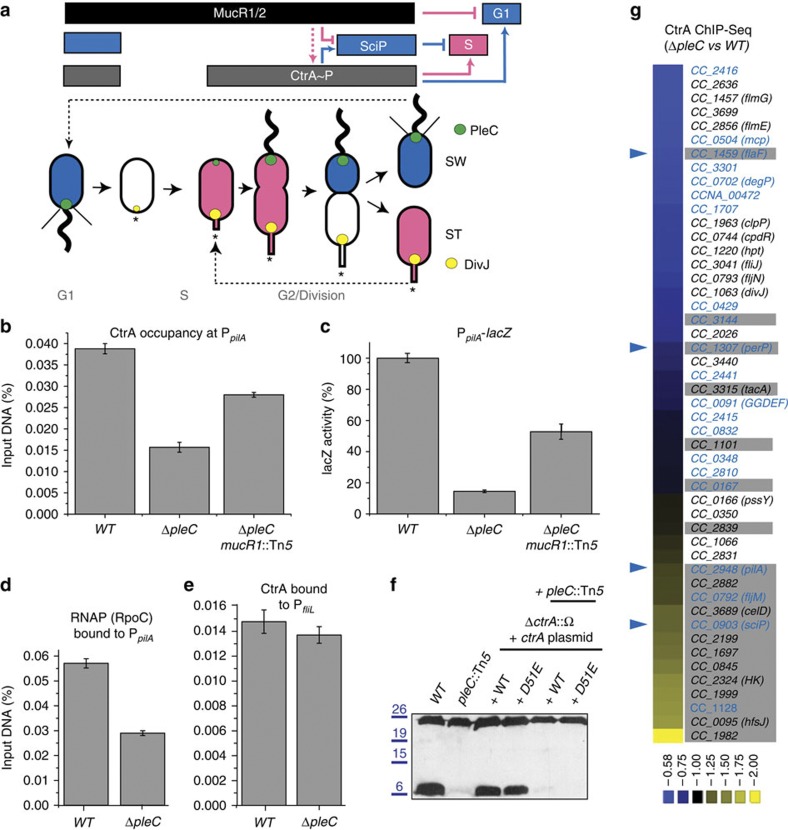
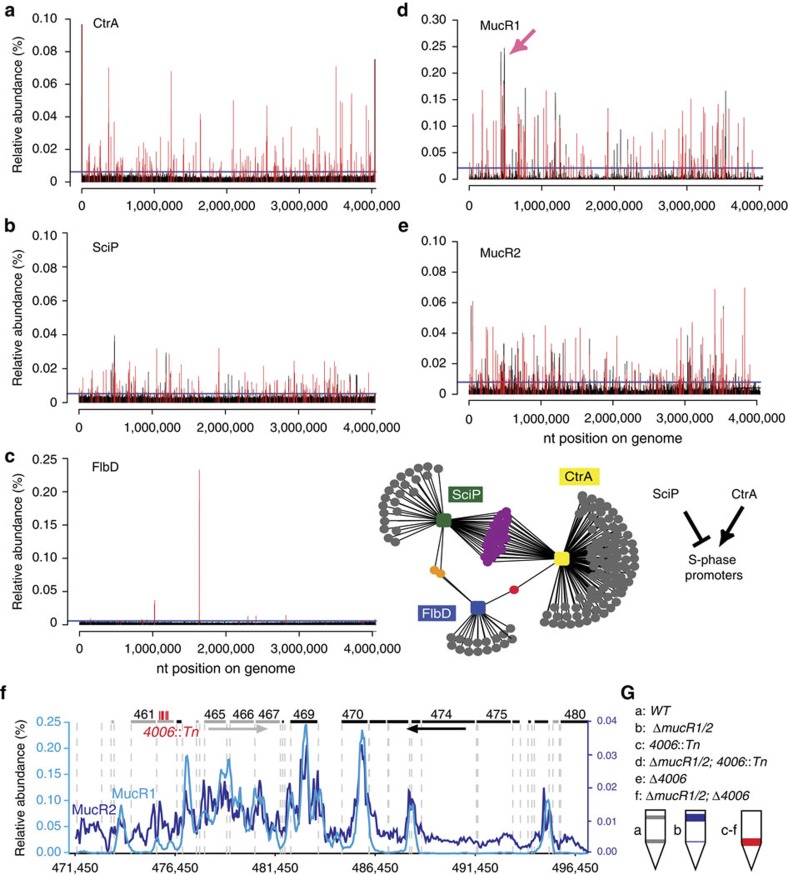
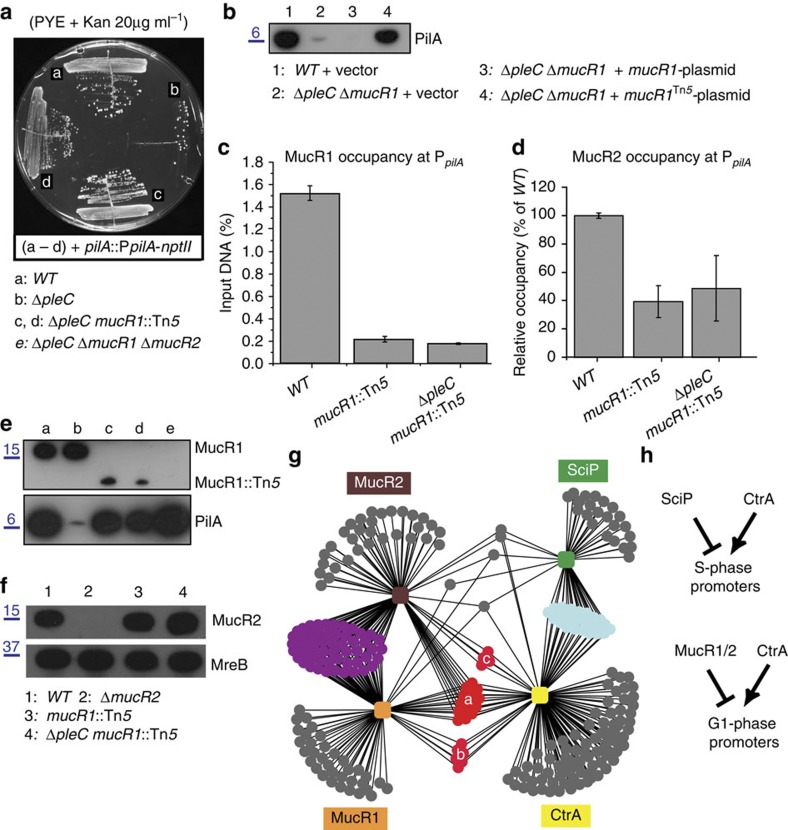
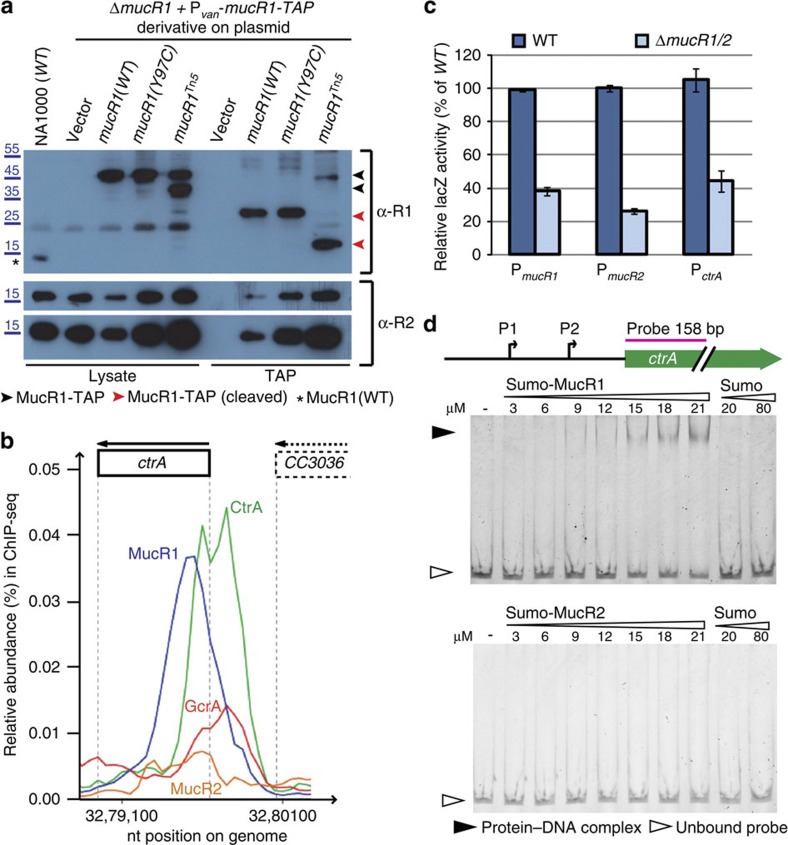
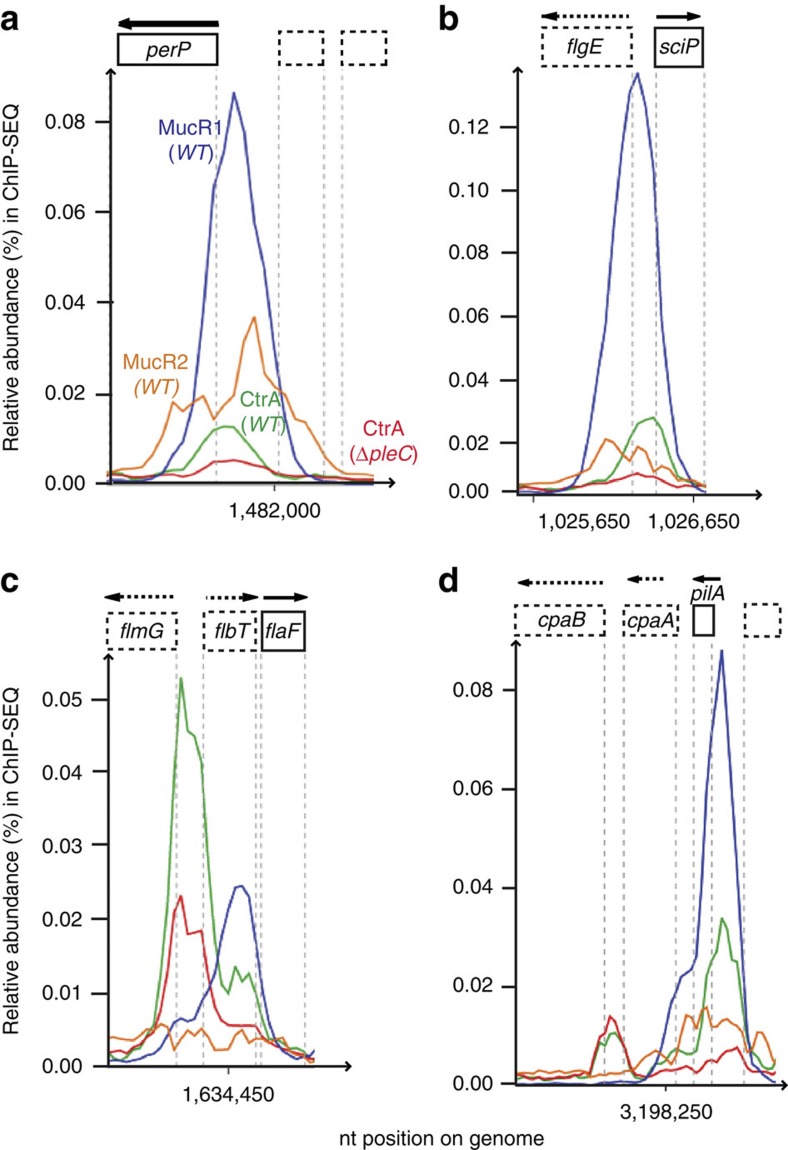
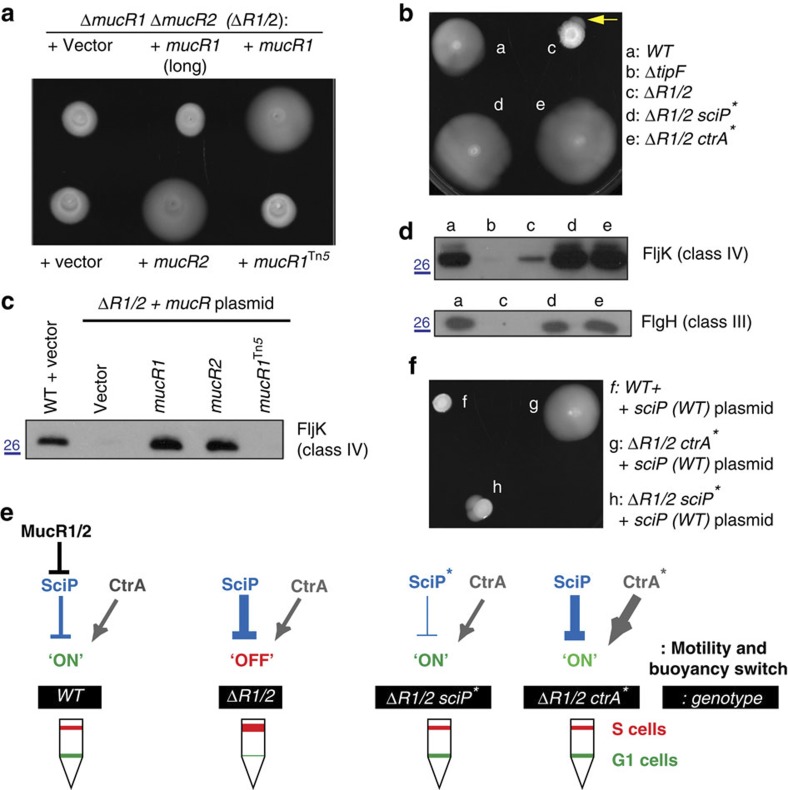
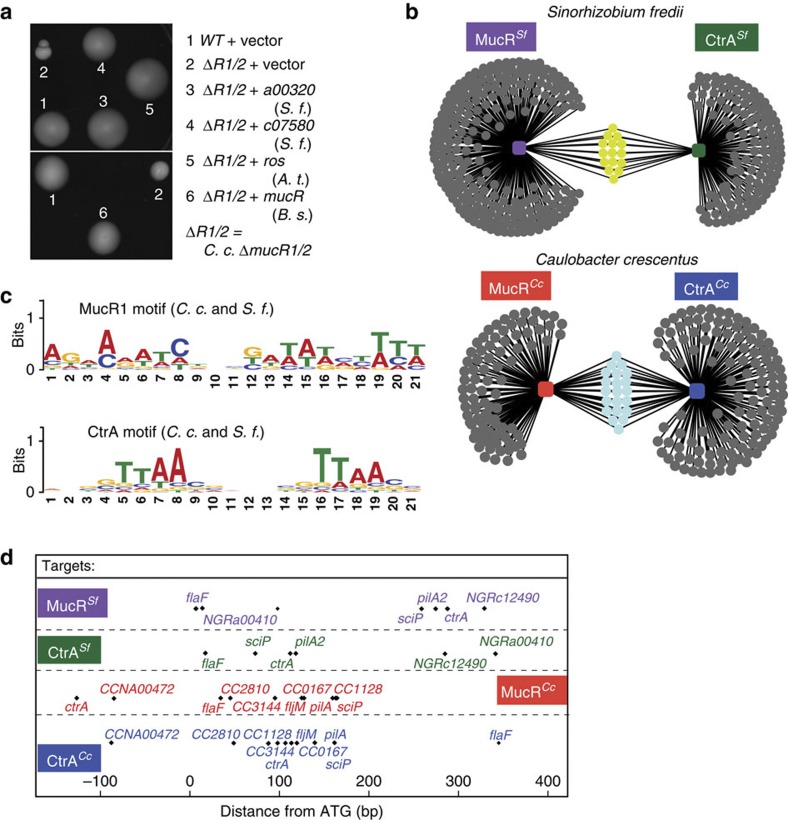
Zinc-finger domain transcriptional regulators regulate a myriad of functions in eukaryotes. Interestingly, ancestral versions (MucR) from Alpha-proteobacteria control bacterial virulence/symbiosis. Whether virulence regulators can also control cell cycle transcription is unknown. Here we report that MucR proteins implement a hitherto elusive primordial S→G1 transcriptional switch. After charting G1-specific promoters in the cell cycle model Caulobacter crescentus by comparative ChIP-seq, we use one such promoter as genetic proxy to unearth two MucR paralogs, MucR1/2, as constituents of a quadripartite and homeostatic regulatory module directing the S→G1 transcriptional switch. Surprisingly, MucR orthologues that regulate virulence and symbiosis gene transcription in Brucella, Agrobacterium or Sinorhizobium support this S→G1 switch in Caulobacter. Pan-genomic ChIP-seq analyses in Sinorhizobium and Caulobacter show that this module indeed targets orthologous genes. We propose that MucR proteins and possibly other virulence regulators primarily control bacterial cell cycle (G1-phase) transcription, rendering expression of target (virulence) genes periodic and in tune with the cell cycle.


Figures

Figure 1
Figure 1. CtrA-bound promoters that are affected in ΔpleC cells.
(a) Schematic of the regulatory interactions between ctrA, sciP and mucR1 and mucR2 (mucR1/2) during the C. crescentus cell cycle. Phosphorylated CtrA (CtrA~P) activates transcription of S- and G1-phase genes. In S-phase, MucR1/2 represses G1-genes such as sciP. The sciP gene is activated in G1 and the newly synthesized SciP translation product represses S-phase promoters. The antagonistic kinase/phosphatase pair, DivJ (yellow dot) and PleC (green dot) indirectly influence CtrA~P and partition with the stalked (ST) cell chamber or swarmer (SW) cell chamber, respectively. PleC promotes CtrA~P accumulation in the SW cell. The dashed arrow indicates that MucR1/2 promote expression of CtrA, but not necessarily its phosphorylation. The star denotes the holdfast. Blue colouring denotes G1-phase transcription, whereas pink is for the late S-phase programme. Light grey labels indicate the cell cycle stages. (be) Occupancy of CtrA and RNA polymerase (RNAP) at the pilA (PpilA) and fliL promoter (PfliL)) in WT (NA1000), ΔpleC and ΔpleC mucR1::Tn5 mutant cells as determined by quantitative chromatin immunoprecipitation assays (qChIP) using antibodies to CtrA or RpoC, as well as pilA transcription measurements conducted using a PpilA-lacZ promoter-probe reporter. Data are from three biological replicates. Error is shown as s.d. (f) Immunoblots showing PilA (lower band, approximately 6 kDa) and CtrA (upper band, approximately 26 kDa) steady-state levels in WT and pleC::Tn5 mutant cells harbouring WT ctrA or phosphomimetic ctrA(D51E) expressed from a plasmid in the absence of chromosomally encoded CtrA (ΔctrA::Ω). Molecular size standards are indicated on the left as blue lines with the corresponding values (blue) in kDa. (g) Comparative ChIP-seq performed with antibodies to CtrA on chromatin from WT and ΔpleC cells. Boxed in grey are PleC:CtrA promoters that were verified as being PleC dependent (Supplementary Fig. 1B). Blue labels indicate PleC:CtrA promoters that are bound by MucR1/2 as determined by the ChIP-seq experiments (Fig. 2). Blue arrowheads point to promoters for which the ChIP-seq traces are shown in Fig. 5. The colour key at the bottom indicates the degree by which the occupancy of CtrA is altered by the ΔpleC mutation, expressed as log2 ratio (Supplementary Data 1).
Figure 2
Figure 2. Genome-wide occupancy of CtrA, SciP, FlbD, MucR1 and MucR2.
(ae). Genome-wide occupancies of CtrA (a), SciP (b), FlbD (c), MucR1 (d) and MucR2 (e) on the C. crescentus genome as determined by ChIP-seq. Note that owing to the ability of the anti-MucR2 antibody to precipitate MucR1, some of the peaks in e could also derive from MucR1, but this is also expected as we show in Fig. 4a that MucR1 can interact with MucR2. The x axis represents the nucleotide position on the genome, whereas the y axis denotes the relative abundance of reads for each probe (see Supplementary Methods for detailed description). Candidate peaks reported in each profile are shown as red bars (‘ANNO probes’; Supplementary Data 1–5), whereas a horizontal blue line in each profile denotes the cutoff applied to separate peaks and background. The middle panel in c depicts the minimal overlap between the targets of SciP, CtrA and FlbD, whereas the right panel illustrates the regulatory relationship between SciP, CtrA and S-phase promoters. The pink arrow in d denotes the 26-kb mobile genetic element (MGE) enlarged in f. (f) ChIP-seq trace of MucR1 (light blue) and MucR2 (dark blue) on the 26-kb MGE. Genes encoded from right to left are shown in grey bars, whereas the black bars indicate genes on the reverse strand. The numbers above refer to the CCNA gene annotation. The himar1 (Tn) insertions in CCNA_04006 are shown as vertical red bars. (g) Buoyancy of WT (grey) and mutant (blue or red) cells harbouring a himar1 (Tn) insertion or an in-frame deletion (Δ) in CCNA_04006 (4006). The schematic shows the sedimentation of cells after Percoll density gradient centrifugation in a test tube. Although WT cells show the typical upper and lower buoyancy conferred by S and G1 cells, respectively, ΔmucR1/2 cells only show the former. CCNA_04006 is epistatic over mucR1/2, as inactivation CCNA_04006 confers the latter buoyancy.
Figure 3
Figure 3. Identification of mucR1/2 as negative regulator of PleC:CtrA promoters.
(a) Growth of WT (a) ΔpleC (b) and derivatives (c,d) carrying the pilA::PpilA–nptII transcriptional reporter on PYE plates containing kanamycin (20μg ml−1). (b) Immunoblot showing PilA steady-state levels in WT and ΔpleC ΔmucR1 double-mutant cells harbouring the empty vector (1 and 2, respectively), and ΔpleC ΔmucR1 cells harbouring either the mucR1- (3) or mucR1Tn5-plasmid (4). Molecular size standards are indicated on the left as blue lines with the corresponding values (blue) in kDa. (c,d) Occupancy of MucR1 (c) and MucR2 (d) at PpilA in WT, ΔpleC mucR1::Tn5 double-mutant and mucR1::Tn5 single-mutant cells as determined by qChIP using antibodies to MucR1 or MucR2. Data are from three biological replicates. Error is shown as s.d. (e) Immunoblots showing MucR1 and PilA steady-state levels in WT (a), ΔpleC (b), ΔpleC mucR1::Tn5 double-mutant (c,d) and ΔpleC ΔmucR1 ΔmucR2 (e) triple-mutant cells. The mucR1::Tn5 allele encodes a truncated derivative of MucR1. Molecular size standards are indicated on the left as blue lines with the corresponding values (blue) in kDa. (f) Immunoblots showing MucR2 and MreB (loading control) steady-state levels in WT (1), ΔmucR2 (2), mucR1::Tn5 (3) and ΔpleC mucR1::Tn5 double-mutant (4) cells. Molecular size standards are indicated on the left as blue lines with the corresponding values (blue) in kDa. (g) Regulatory network showing putative promoters (dots) bound by CtrA, MucR1, MucR2 and SciP as inferred from ChIP-seq results in WT cells (Fig. 2). Common targets between MucR1 and MucR2 are shown in purple, between CtrA and SciP are shown in turquoise and between MucR and CtrA in red. This last group is subdivided into those bound by MucR1/MucR2/CtrA (a), MucR1/CtrA (b) and MucR2/CtrA (c). Note that MucR1/2 and SciP have few common targets. See also Supplementary Data 8 for a prediction of specific and common MucR1 and MucR2 targets. (h). Scheme showing the predicted direct regulatory interactions at G1 or late S-phase promoters inferred from g.
Figure 4
Figure 4. Heterodimerization and auto-regulation by MucR1/2.
(a) Immunoblots showing that MucR2 co-purifies with MucR1-TAP before (that is, in cell lysates, lysate) or after the first TAP purification step (cleavage with TEV protease, TAP). The upper panel shows a blot probed with antibodies to MucR1 (α-R1). The asterisk indicates untagged MucR1 in wild-type (NA1000) cells. The arrowheads indicate MucR1-TAP before (black) or after (red) cleavage of the protein-A moiety in the TAP tag with the TEV protease, eluting the proteins from the IgG agarose beads. The two lowest panels shows a blot probed with antibodies to MucR2 (α-R2) revealed at two different exposures. The lower amount of MucR2 that co-purifies with WT MucR1-TAP compared with MucR1(Y97C) or MucR1Tn5 proteins is likely because of a reduction in the total MucR2 levels when MucR1 is overexpressed. Molecular size standards are indicated on the left as blue lines with the corresponding values (blue) in kDa. (b) Traces of the occupancy of various transcription factors at the ctrA promoter based on ChIP-seq data. (c) β-Galactosidase measurements in extracts of WT (dark blue) and ΔR1/2 (light blue) cells harbouring a PctrA-, PmucR1- or PmucR2-lacZ promoter-probe plasmid. Data are from three biological replicates. Error is shown as s.d. (d) Electrophoretic mobility shift assay (EMSA) showing the binding of His6-SUMO-MucR1 or -MucR2 to PctrA. The white arrows indicate the unbound probe. The black arrows indicate the shifted ctrA probes bound by MucR1. His6-SUMO-MucR2 or His6-SUMO does not retard the probe.
Figure 5
Figure 5. PleC:CtrA target promoters that are bound and regulated by MucR1/2.
(ad) Traces of the occupancy of MucR1 (blue), MucR2 (orange) and CtrA (green) in WT cells and CtrA in ΔpleC (red) cells as determined by ChIP-seq data. Note that in panel c, the MucR1 binding overlaps the second binding site of CtrA upstream of the flaF gene.
Figure 6
Figure 6. Regulatory interplay between mucR1/2, sciP and ctrA in the control of motility.
(a,b). The motility defect of ΔmucR1 ΔmucR2 double-mutant cells (ΔR1/2) can be rescued by expression of mucR1 or mucR2 from a plasmid or by point mutation in sciP or ctrA. (a) Motility plates (0.3% agar) inoculated with ΔR1/2 cells containing the empty plasmid or derivatives with mucR1 (long form, original annotation of CC_0933), mucR1Tn5 or the plasmids carrying mucR1 (CCNA_00982) or mucR2 (CCNA_00998). (b) The motility of ΔR1/2 (c) cells harbouring point mutation in sciP (d) or in ctrA (e) relative to WT cells (a). The yellow arrow points to the emergence of motile suppressors from a non-motile inoculum of ΔR1/2 cells (c) versus WT (a) cells on motility agar. (c) Immunoblot showing the abundance of a class IV gene product (the FljK flagellin) in the supernatant of WT and ΔR1/2 cells containing the plasmids described in a. Molecular size standards are indicated on the left as blue lines with the corresponding values (blue) in kDa. (d) Immunoblots showing the steady-state levels of a class IV gene product (the FljK flagellin) and a class III gene product (the FlgH L-ring protein) in WT (a), ΔR1/2 (c), ΔR1/2 sciP* (d) and ΔR1/2-ctrA* (e) cells. Also shown are the FljK levels in ΔtipF cells as a comparison (b). Molecular size standards are indicated on the left as blue lines with the corresponding values (blue) in kDa. (e) Model based on the regulatory interactions elucidated above. Misregulation of sciP expression in ΔR1/2 impairs motility. A hypomorphic allele of sciP (sciP*) or hypermorphic allele of ctrA (ctrA*) can restore motility to ΔR1/2 cells. The buoyancy phenotype in WT and mutant cells is shown underneath. Note that the sciP* and ctrA* mutations restore the WT buoyancy phenotype, indicating adequate regulation of buoyancy effector(s). (f) The sciP overexpression plasmid pMT335-sciP inhibits motility in the WT (f) and in ΔR1/2 sciP* (h), but not ΔR1/2 ctrA* (g) cells.
Figure 7
Figure 7. Conservation of direct regulation by MucR and CtrA in C. crescentus and S. fredii NGR234.
(a) Motility agar was inoculated with WT and ΔR1/2 containing the empty vector or derivatives with mucR homologues from different alpha-Proteobacteria: S. fredii (S. f) a00320 (3) and S. f c07580 (4), A. tumefaciens (A. t) ros (5), B. suis (B. s) mucR (6). (b) Network of DNA targets shared by CtrA and MucR in S. fredii str. NGR234 (S. f., upper) and in C. crescentus (C. c., lower). (c) In silico deduced binding motif of CtrA and MucR for C. c. and S. f. (d) Relative distance of CtrA- and MucR1-binding site relative to the ATG of common targets in C. c. and in S. f. NGR_c12490 is orthologous to CC_0167 and NGR_a00410 to CCNA_00472.

References

    1. Laub M. T., Shapiro L. & McAdams H. H. Systems biology of Caulobacter. Annu. Rev. Genet. 41, 429–441 (2007). - PubMed
    1. Murray S. M., Panis G., Fumeaux C., Viollier P. H. & Howard M. Computational and genetic reduction of a cell cycle to its simplest, primordial components. PLoS Biol. 11, e1001749 (2013). - PMC - PubMed
    1. Hallez R., Bellefontaine A. F., Letesson J. J. & De Bolle X. Morphological and functional asymmetry in alpha-proteobacteria. Trends Microbiol. 12, 361–365 (2004). - PubMed
    1. Kahng L. S. & Shapiro L. The CcrM DNA methyltransferase of Agrobacterium tumefaciens is essential, and its activity is cell cycle regulated. J. Bacteriol. 183, 3065–3075 (2001). - PMC - PubMed
    1. De Nisco N. J., Abo R. P., Wu C. M., Penterman J. & Walker G. C. Global analysis of cell cycle gene expression of the legume symbiont Sinorhizobium meliloti. Proc. Natl Acad. Sci. USA 111, 3217–3224 (2014). - PMC - PubMed

Publication types

MeSH terms

Associated data