. 2015 Jan;72(1):137-51.
doi: 10.1007/s00018-014-1661-9. Epub 2014 Jun 18.

Exceptionally abundant exceptions: comprehensive characterization of intrinsic disorder in all domains of life

Affiliations

Exceptionally abundant exceptions: comprehensive characterization of intrinsic disorder in all domains of life

Zhenling Peng et al. Cell Mol Life Sci. 2015 Jan.

Abstract

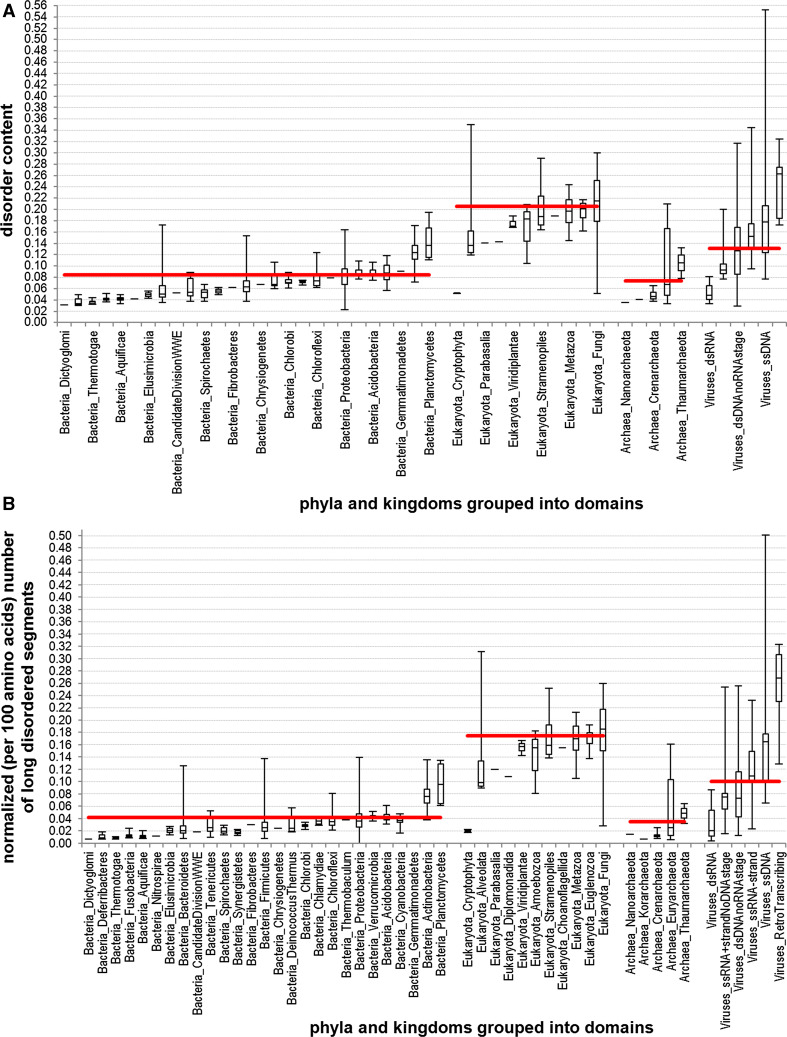
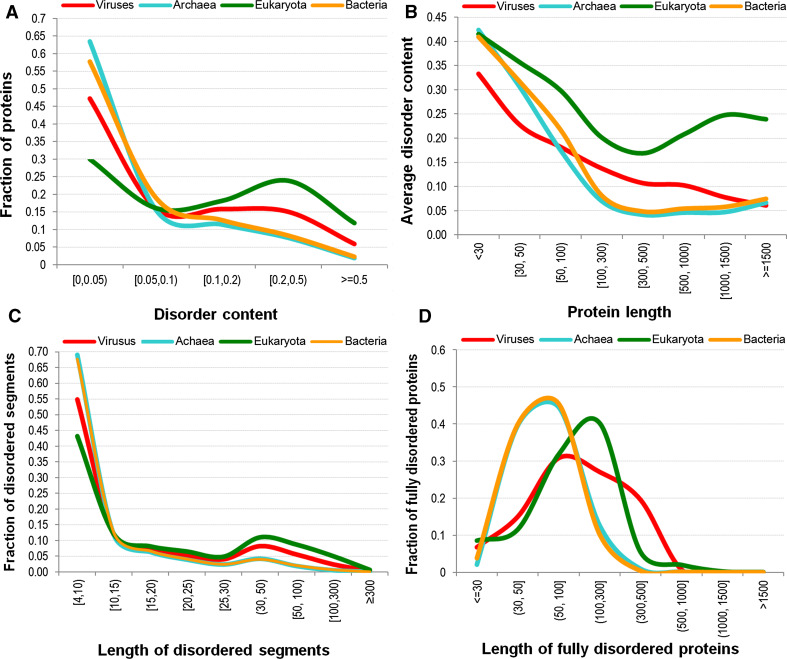
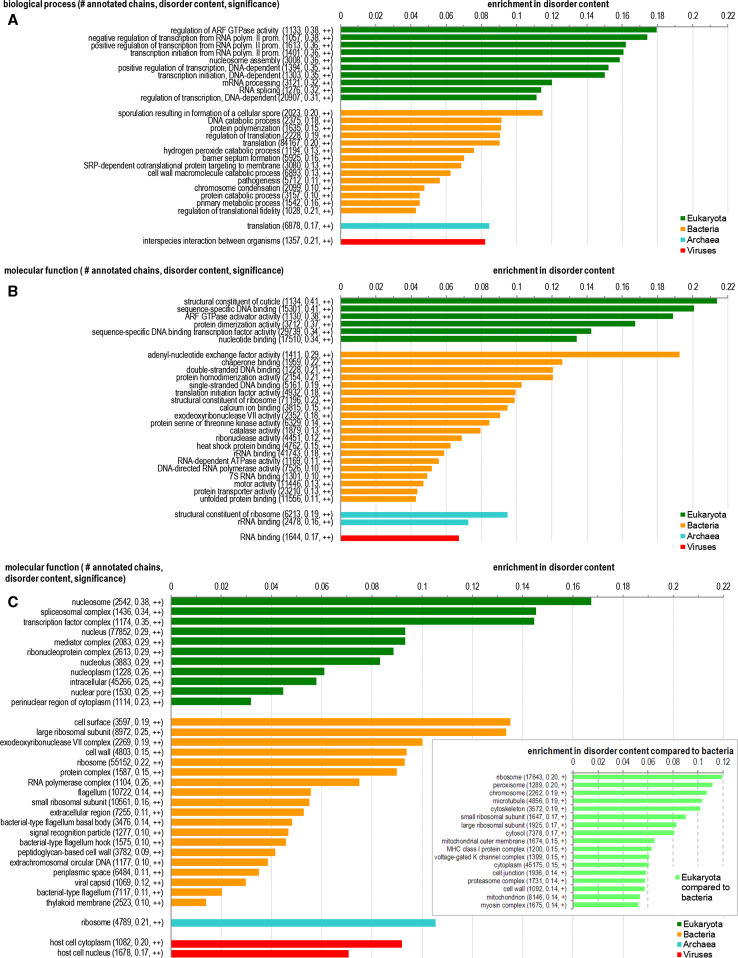
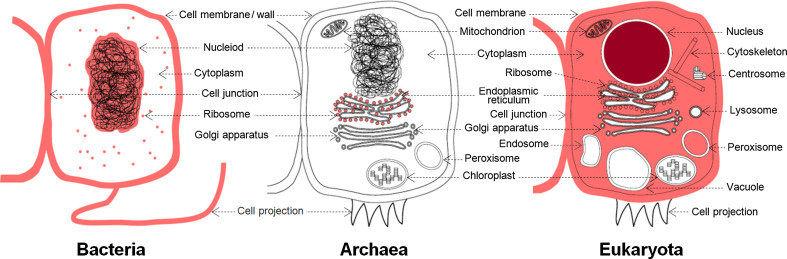
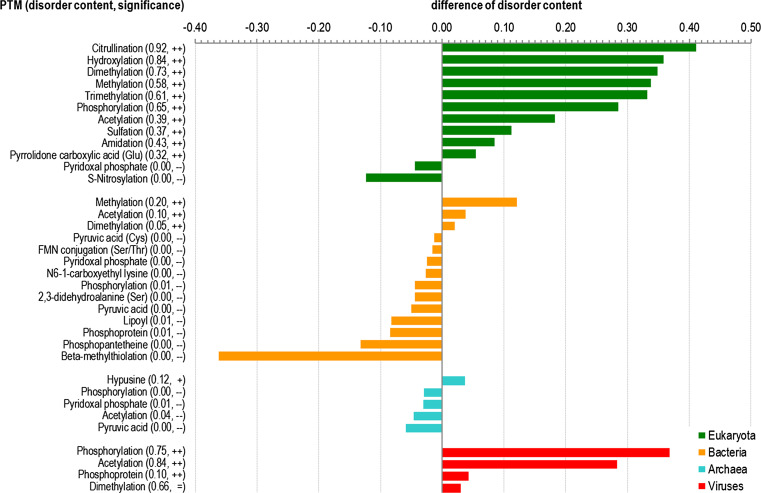
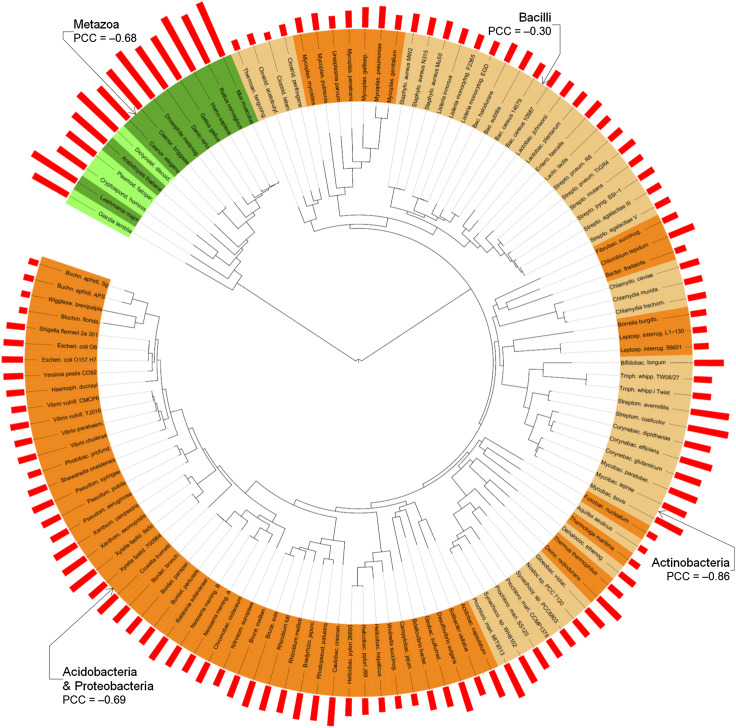
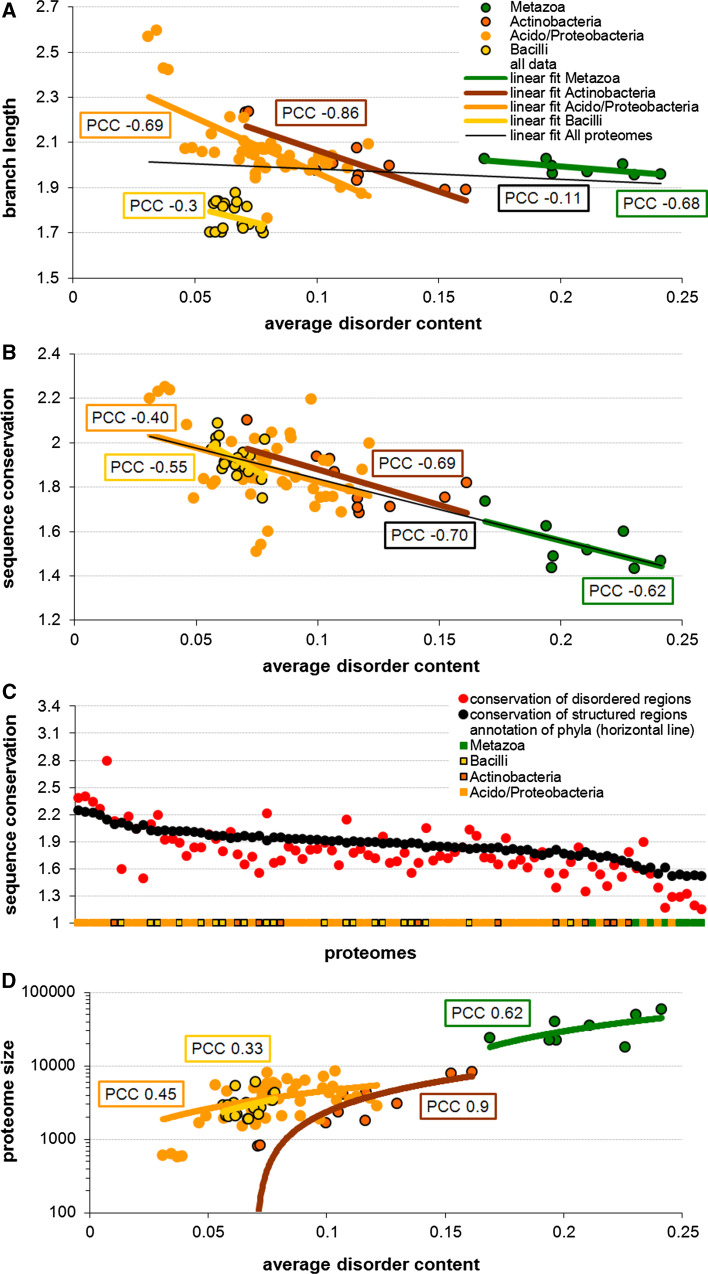
Recent years witnessed increased interest in intrinsically disordered proteins and regions. These proteins and regions are abundant and possess unique structural features and a broad functional repertoire that complements ordered proteins. However, modern studies on the abundance and functions of intrinsically disordered proteins and regions are relatively limited in size and scope of their analysis. To fill this gap, we performed a broad and detailed computational analysis of over 6 million proteins from 59 archaea, 471 bacterial, 110 eukaryotic and 325 viral proteomes. We used arguably more accurate consensus-based disorder predictions, and for the first time comprehensively characterized intrinsic disorder at proteomic and protein levels from all significant perspectives, including abundance, cellular localization, functional roles, evolution, and impact on structural coverage. We show that intrinsic disorder is more abundant and has a unique profile in eukaryotes. We map disorder into archaea, bacterial and eukaryotic cells, and demonstrate that it is preferentially located in some cellular compartments. Functional analysis that considers over 1,200 annotations shows that certain functions are exclusively implemented by intrinsically disordered proteins and regions, and that some of them are specific to certain domains of life. We reveal that disordered regions are often targets for various post-translational modifications, but primarily in the eukaryotes and viruses. Using a phylogenetic tree for 14 eukaryotic and 112 bacterial species, we analyzed relations between disorder, sequence conservation and evolutionary speed. We provide a complete analysis that clearly shows that intrinsic disorder is exceptionally and uniquely abundant in each domain of life.


Figures

Fig. 1
Fig. 1
Disorder content (panel A) and normalized number of long (30 or more consecutive amino acids) disordered segments across different phyla and kingdoms (second level of the taxonomic lineage). The phyla and kingdoms (x-axis) are grouped into domains of life including bacteria, eukaryota, archaea, and viruses. Solid horizontal red lines denote average disorder content per domain of life. Box plots show the minimum, first quartile, second quartile (median), third quartile, and maximum disorder content (panel A) or normalized number of long disordered segments (panel B) across different species in a given phyla/domain of life; one line is shown for phyla with only one species (e.g., Dictyoglomi)
Fig. 2
Fig. 2
Distribution of disorder content (panel A), disorder content against chain size (panel B), size of the disordered segments (panel C), and size of the fully disordered proteins (panel D) for the four domains of life
Fig. 3
Fig. 3
Biological processes (panel A), molecular function (panel B), and cellular components (panel C) that are significantly enriched in the disorder across eukaryotic, bacterial, archaea, and viral species. The y-axis gives all significant functions/components, including the number of corresponding proteins, their average disorder content, and significance of the enrichment. The x-axis shows the enrichment in the average disorder content between proteins with a given function/in a given compartment and the baseline disorder content in a given domain of life. Details of the calculation are provided in the Materials and Methods section. The significance of the difference is denoted with “ + ” and “ ++”, which indicate that the P-value is smaller than 0.01 and 0.001, respectively. The functions/cellular components are sorted, within each domain of life, by the values of the enrichment
Fig. 4
Fig. 4
Mapping of intrinsic disorder into eukaryotic, bacterial, and archaea cells. The cellular components significantly enriched in disorder from Fig. 3C were mapped into the corresponding organelles/compartments. The light red color in bacteria or archaea cells identifies compartments that include at least one annotation that is enriched by at least 5 % in the disorder content in this domain of life. In the eukaryotic cell, the dark red color shows compartments that include at least one annotation enriched by at least 5 % in eukaryota, while the light red color denotes compartments with annotations enriched by at least 5 % compared to the disorder in bacteria (based on inset in Fig. 3C)
Fig. 5
Fig. 5
Post-translational modifications (PTMs) that are significantly enriched/depleted in the disorder across eukaryotic, bacterial, archaea, and viral species. The y-axis gives PTMs, including the average disorder content among the corresponding amino acids and significance of the enrichment/depletion. The x-axis shows the difference in the average disorder content between amino acids with a given PTM and the baseline disorder content in a given domain of life. The significance of the difference is denoted with “–” and “-”, which indicate that the disorder is depleted with a P value smaller than 0.01 and 0.001, respectively; “+” and “++”, which indicate that the disorder is enriched with a P value smaller than 0.01 and 0.001, respectively; and “=”, which shows that disorder is not significantly different. The PTMs are sorted, within each domain of life, by the values of the difference
Fig. 6
Fig. 6
The phylogenetic tree based on Ref. [47], with 126 species whose proteomes have been fully sequenced, including 14 in eukaryota (on green background) and 112 in bacteria (on orange background). Labels indicate individual species and color shadings indicate subdivisions into phyla, where alternating light and dark green are for phyla in eukaryotes and light and dark orange are for phyla in bacteria. The red bars on the outside indicate the disorder content. The length of the solid black lines on the inside indicates speed of evolution, as estimated in Ref. [47]. Phyla with at least eight species are named on the outside, together with the corresponding value of the Pearson correlation coefficient (PCC) between the speed of evolution and disorder content
Fig. 7
Fig. 7
Relation between disorder content and evolutionary characteristics, including evolutionary speed, sequence conservation and proteome size, for the bacterial and eukaryotic species. Panels A and B show relationship of the disordered content with the pace of evolution quantified using branch length in an evolutionary tree, and with the sequence conservation, respectively. Panel C compares sequence conservation of disordered (red markers) and structured (black markers) regions across the species grouped by phyla, which are denoted using the horizontal line at the bottom; species are sorted by the conservation of their structured regions. Panel D shows the relation between disorder content and proteome size. Solid lines in panels A, B, and D show linear fits together with the corresponding value of the PCC; y-axis in panel D is in logarithmic scale. The conservation was estimated based on relative entropy of WOP profiles produced by PSI-BLAST that was run against the nr database

References

    1. Wright PE, Dyson HJ. Intrinsically unstructured proteins: re-assessing the protein structure-function paradigm. J Mol Biol. 1999;293(2):321–331. doi: 10.1006/jmbi.1999.3110. - DOI - PubMed
    1. Dunker AK, et al. Intrinsically disordered protein. J Mol Graph Model. 2001;19(1):26–59. doi: 10.1016/S1093-3263(00)00138-8. - DOI - PubMed
    1. Uversky VN. Protein folding revisited. A polypeptide chain at the folding-misfolding-nonfolding cross-roads: which way to go? Cell Mol Life Sci. 2003;60(9):1852–1871. doi: 10.1007/s00018-003-3096-6. - DOI - PMC - PubMed
    1. Turoverov KK, Kuznetsova IM, Uversky VN. The protein kingdom extended: ordered and intrinsically disordered proteins, their folding, supramolecular complex formation, and aggregation. Prog Biophys Mol Biol. 2010;102(2–3):73–84. doi: 10.1016/j.pbiomolbio.2010.01.003. - DOI - PMC - PubMed
    1. Uversky VN, Dunker AK. Understanding protein non-folding. Biochim Biophys Acta. 2010;1804(6):1231–1264. doi: 10.1016/j.bbapap.2010.01.017. - DOI - PMC - PubMed

LinkOut - more resources